We've all been there: staring at a forex chart, watching the lines and candles dance, and feeling a bit overwhelmed while wondering: what was the purpose of this trading pattern? The truth is, these aren't just abstract shapes; they are the market’s language, whispering clues about where prices might realistically head next.
For forex traders, understanding trading patterns unlocks a world of strategic possibilities, from spotting trends to timing trades with precision. Let's find out now!
Key takeaways:
- Trading patterns defined: Recurring chart formations that reflect market psychology, helping traders predict price movements like trends, reversals, or consolidations.
- Core purposes: Patterns assist in identifying market trends, forecasting reversals, and providing clear entry/exit signals for informed trading decisions.
- Types of patterns: Continuation (e.g., ascending triangles), reversal (e.g., double bottom), and bilateral (e.g., symmetrical triangles) patterns serve distinct roles in navigating market conditions.
- Practical application: Effective use involves confirming patterns with indicators (RSI, MACD), analyzing market context, and applying disciplined risk management.
- Tools for success: Platforms like MetaTrader 4, MetaTrader 5, and TradingView enhance pattern recognition with charting tools and automated alerts.
- Avoiding pitfalls: Common mistakes include relying solely on patterns, ignoring market context, and poor risk management, which can lead to false signals and losses.
- Broader Relevance: Patterns are versatile, applicable across forex, stocks, and crypto, making them essential for traders in multiple markets.
1. What is the meaning of trading pattern?
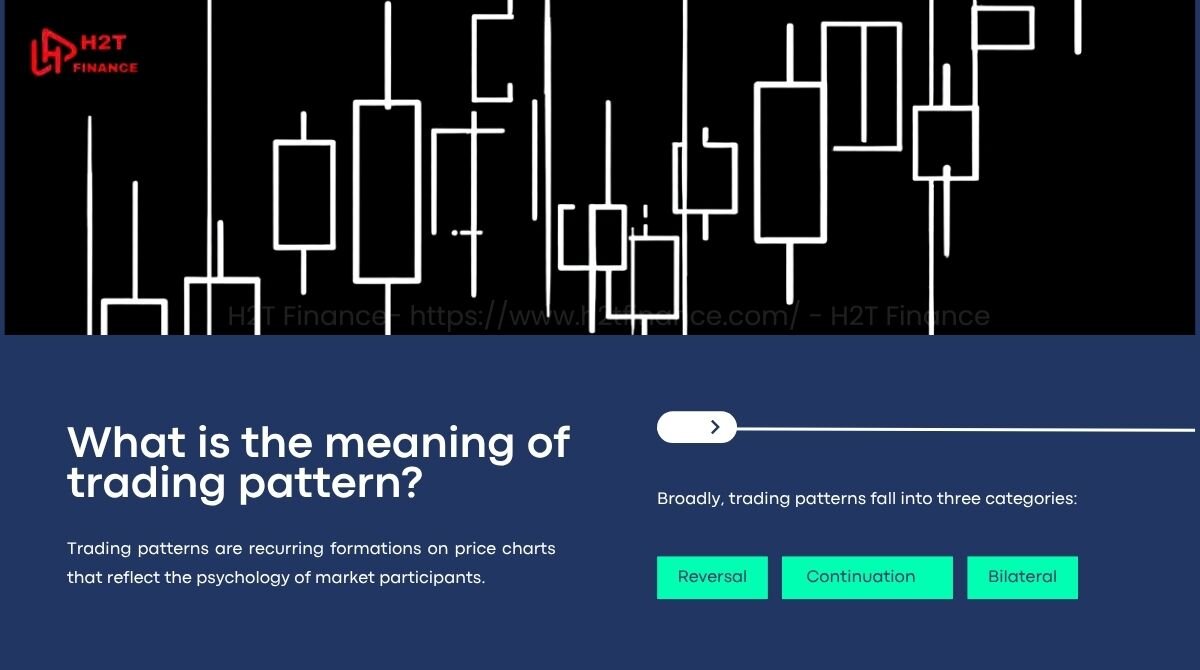
Trading patterns are recurring formations on price charts that reflect the psychology of market participants. These patterns, formed by price movements over time, help traders anticipate future price directions.
In technical analysis, they are the backbone of predicting trends, reversals, or consolidations. Understanding what is the meaning of trading pattern and more broadly, what is pattern trading is crucial for forex traders aiming to interpret market signals accurately.
- Definition and role: So, what exactly are we looking at here? At its core, a trading pattern is simply a recognizable shape that you can spot on a chart. It's formed by connecting key price points like the highs, lows, or closing prices over a certain period. You’ll typically identify these patterns using trendlines to outline familiar geometric shapes, such as triangles or wedges.
They provide insights into market sentiment, showing whether buyers or sellers are in control. For instance, a pattern like the double bottom signals a potential bullish reversal, indicating buyers are overpowering sellers.
- Types of patterns: Broadly, trading patterns fall into three categories: continuation, reversal, and bilateral. Continuation patterns, like ascending triangles, suggest the current trend will persist. Reversal patterns, such as head and shoulders, indicate a potential trend change.
Bilateral patterns, like symmetrical triangles, signal potential movement in either direction, ideal for volatile markets. Each type serves a unique purpose in guiding trading decisions.
- Why patterns matter: Patterns simplify complex market data, making it easier to spot opportunities. By studying historical price movements, traders can recognize patterns that have tended to lead to similar outcomes in the past.
However, it's crucial to remember that no pattern is a guarantee, and past performance does not ensure future results. For example, a pennant pattern often follows a sharp price move, suggesting a brief consolidation before the trend potentially continues.
2. What was the purpose of trading patterns in forex?
Trading patterns serve as essential tools for forex traders, helping them navigate the complex and volatile currency markets. By understanding what was the purpose of this trading pattern, traders can make more informed decisions, whether they’re spotting trends, anticipating reversals, or planning entry and exit points.
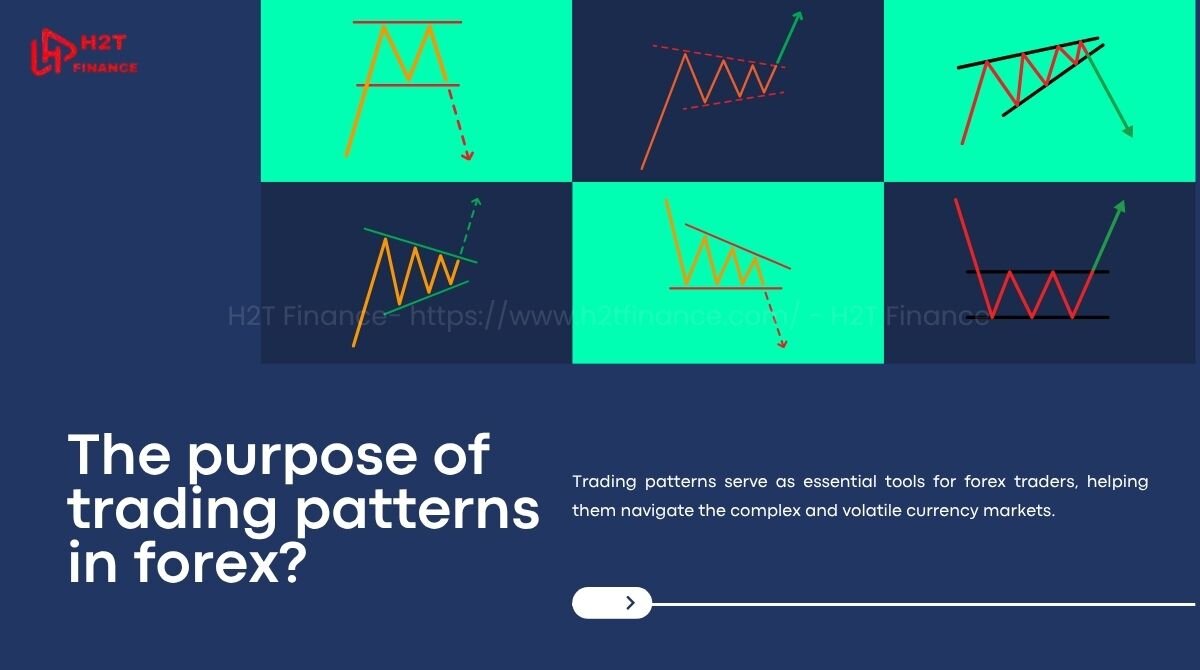
This section explores the core purposes of trading patterns in forex, rooted in market psychology and technical analysis principles.
Trading patterns are not random shapes; they reflect the collective behavior of market participants. Their primary purposes in forex trading include identifying market trends, forecasting potential reversals, and providing actionable signals for trade execution. Let’s break down these purposes to see how they empower traders to strategize effectively.
Identifying trends:
Trading patterns help traders determine whether the market is in an uptrend, downtrend, or consolidation phase. For instance, an ascending triangle pattern often appears during an uptrend, signaling that buyers are maintaining control.
Recognizing these trends allows traders to align their strategies with the market’s direction, increasing the likelihood of profitable trades. Patterns like trendlines, which connect a series of highs or lows, further clarify the trend’s strength and trajectory.
Predicting reversals:
One key purpose of trading patterns is to signal when a trend might reverse. Reversal patterns, such as the double top or head and shoulders, indicate a shift in market sentiment.
For example, a double top forms when the price hits a resistance level twice and fails to break through, suggesting sellers are gaining dominance. This insight helps traders prepare for a potential downtrend, either by exiting long positions or entering short ones.
Providing entry and exit signals:
Trading patterns offer clear signals for when to enter or exit trades, reducing guesswork. A breakout from a continuation pattern, like a pennant, signals an entry point to ride the trend.
Conversely, a reversal pattern like a double bottom provides an exit signal for a downtrend and an entry for a new uptrend. These signals are critical for timing trades to maximize profits and minimize losses.
Reflecting market psychology:
Patterns emerge from the interplay of supply and demand, driven by the emotions and actions of traders.
For example, a double bottom pattern shows that buyers are stepping in at a support level, pushing the price upward after repeated tests. Understanding this psychology helps traders anticipate how the market might react at key price levels.
3. Key types of trading patterns and their purposes
To fully grasp what was the purpose of this trading pattern, it’s essential to understand the different types of trading patterns and their specific roles in forex trading. Trading patterns fall into three main categories: continuation, reversal, and bilateral.
Each type serves a distinct purpose, helping traders navigate trends, anticipate reversals, or prepare for volatile market moves. This section breaks down these categories, their purposes, and examples to guide your trading strategy.
3.1. Continuation patterns
Continuation patterns signal that the current market trend whether bullish or bearish will likely persist. These patterns are valuable for traders looking to ride an existing trend for maximum profit. They often appear during brief pauses or consolidations in the market, indicating that the trend will resume once the pattern completes.
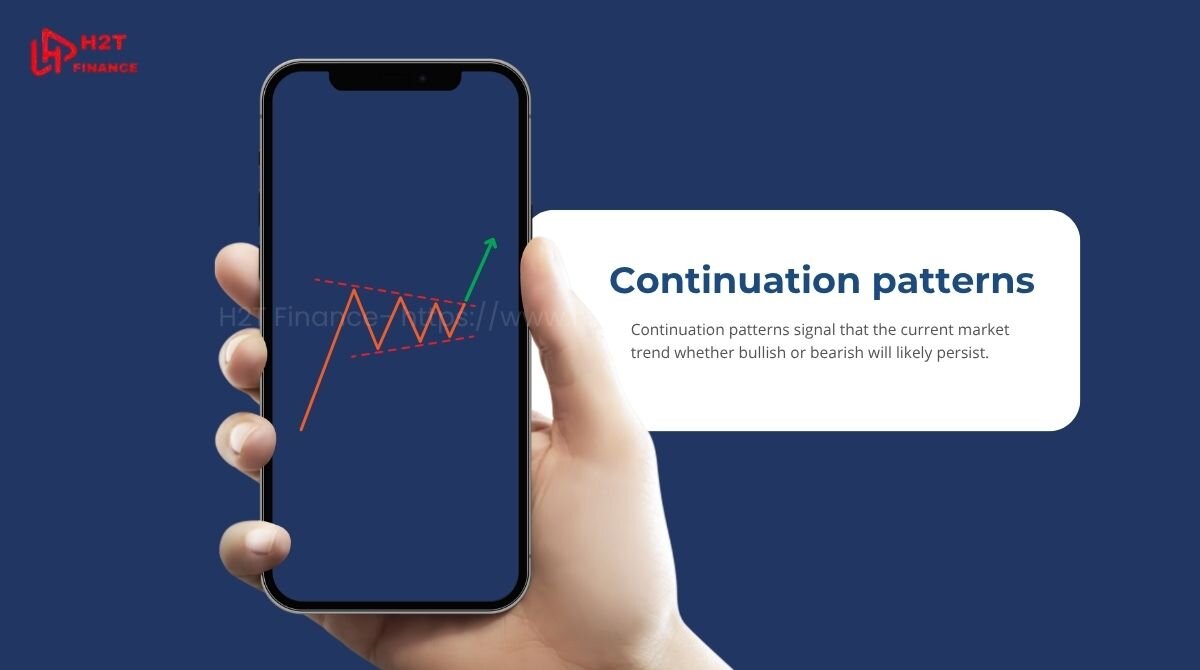
- Definition and purpose: Continuation patterns suggest that the price will continue moving in the direction of the prevailing trend. They help traders identify opportunities to stay in a trade longer, capitalizing on sustained momentum.
- Examples: Common continuation patterns include ascending triangles, descending triangles, pennants, and flags. An ascending triangle, characterized by a horizontal resistance line and an ascending support line, indicates that the price is likely to break upward, continuing the bullish trend.
- Application: Traders use these patterns to time entries during pullbacks within a trend. For instance, entering a long position on a breakout from a pennant can align with a strong uptrend.
3.2. Reversal patterns
Reversal patterns indicate a potential change in the market’s direction, signaling the end of an existing trend and the start of a new one. These patterns are crucial for traders aiming to capitalize on trend shifts, either by exiting current positions or entering new ones in the opposite direction.
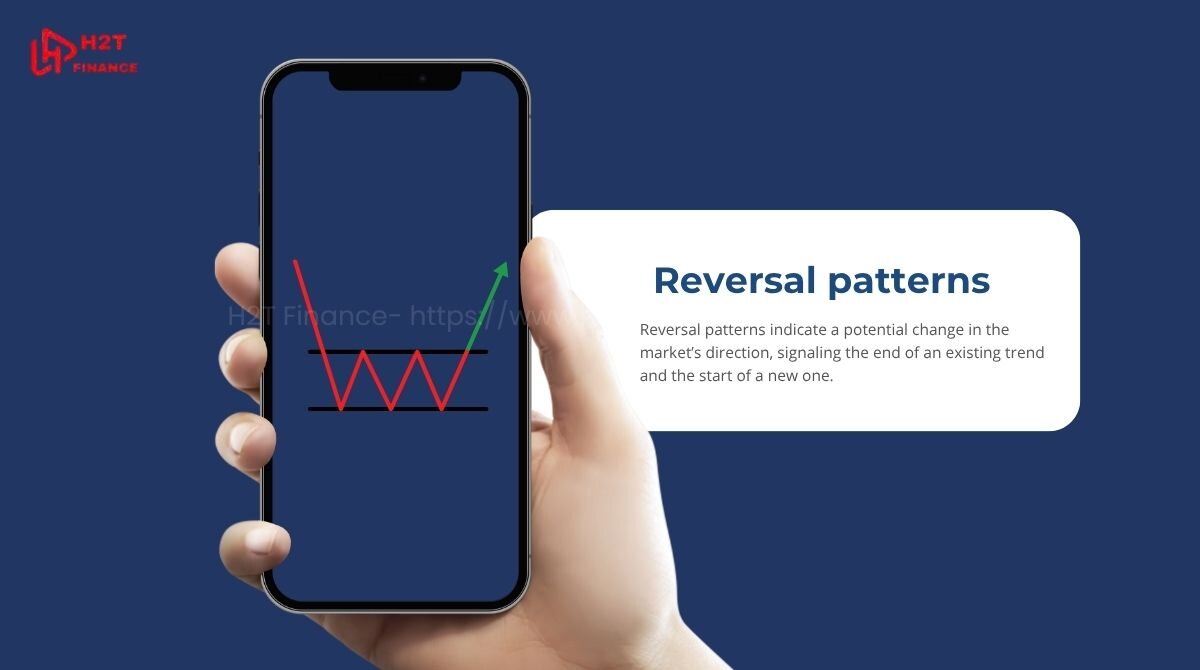
- Definition and purpose: Reversal patterns highlight moments when market sentiment shifts, such as from bullish to bearish or vice versa. They help traders anticipate significant price movements, allowing them to adjust their strategies accordingly.
- Examples: Key reversal patterns include head and shoulders, double top, double bottom, and rounding bottom. A double bottom, for instance, forms after a downtrend when the price tests a support level twice, indicating buyers are stepping in to push the price upward.
- Application: Traders use reversal patterns to set entry points for new trends or exit points to avoid losses. For example, a trader might short a currency pair after a double top confirms a bearish reversal.
3.3. Bilateral patterns
Bilateral patterns indicate that the price could move in either direction, making them ideal for volatile markets where the trend is unclear. These patterns help traders prepare for potential breakouts, whether bullish or bearish, by staying flexible in their strategies.
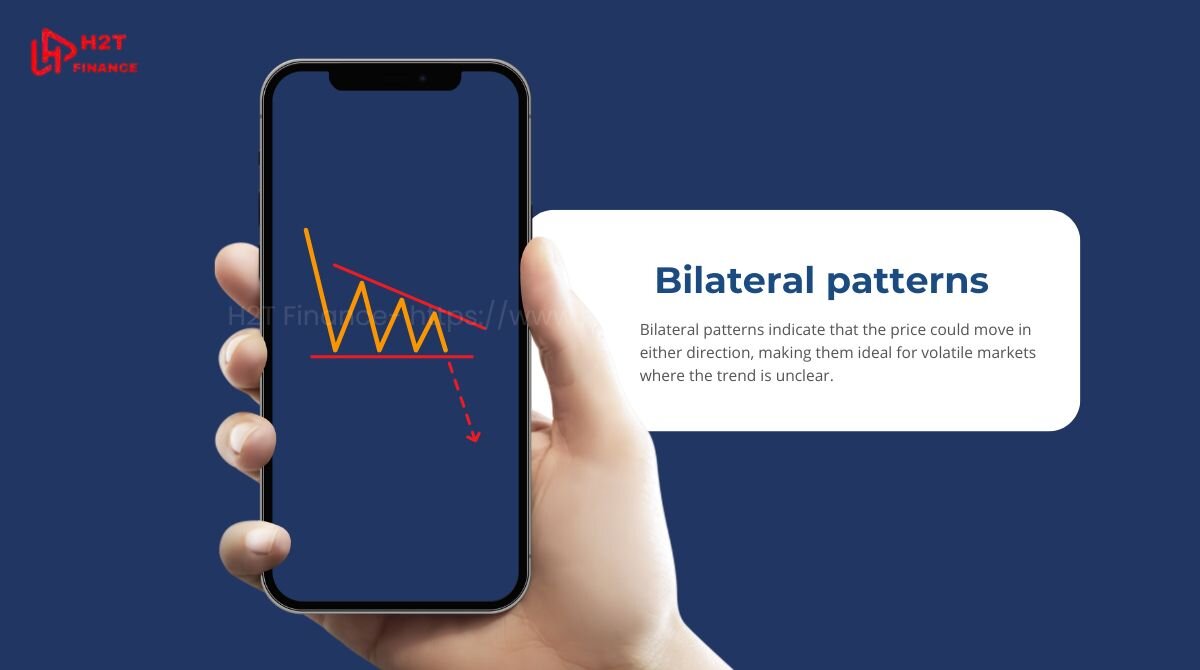
- Definition and purpose: Bilateral patterns, such as symmetrical triangles, suggest a period of consolidation before a breakout. Their purpose is to alert traders to high-probability breakout opportunities, allowing them to position for either an upward or downward move depending on the breakout direction.
- Examples: The symmetrical triangle is a classic bilateral pattern, formed by converging trendlines as the price makes lower highs and higher lows. It signals indecision in the market, with a breakout likely to follow the overall trend or a new direction.
- Application: Traders use bilateral patterns in volatile markets, often combining them with other indicators like volume or RSI to confirm the breakout direction. For instance, a breakout above a symmetrical triangle in a bullish market suggests a continuation, while a downward breakout may signal a reversal.
| Pattern type | Example | Purpose | Market context |
|---|---|---|---|
| Continuation | Ascending triangle | Extend trend | Strong trend |
| Reversal | Double top | Signal trend change | Trend exhaustion |
| Bilateral | Symmetrical triangle | Anticipate breakout | Volatile or consolidating market |
4. How to use trading patterns in forex strategies
Knowing what was the purpose of this trading pattern is only half the battle; applying them effectively in forex strategies is where traders turn knowledge into action. Trading patterns provide actionable insights, but using them correctly requires a structured approach and risk management.
This section offers a practical guide on integrating trading patterns into your forex trading, complete with steps and a real-world example to help you trade smarter.
4.1. Step-by-step guide
Trading patterns are powerful when combined with a disciplined strategy. Following a clear process ensures you maximize their potential while minimizing risks.
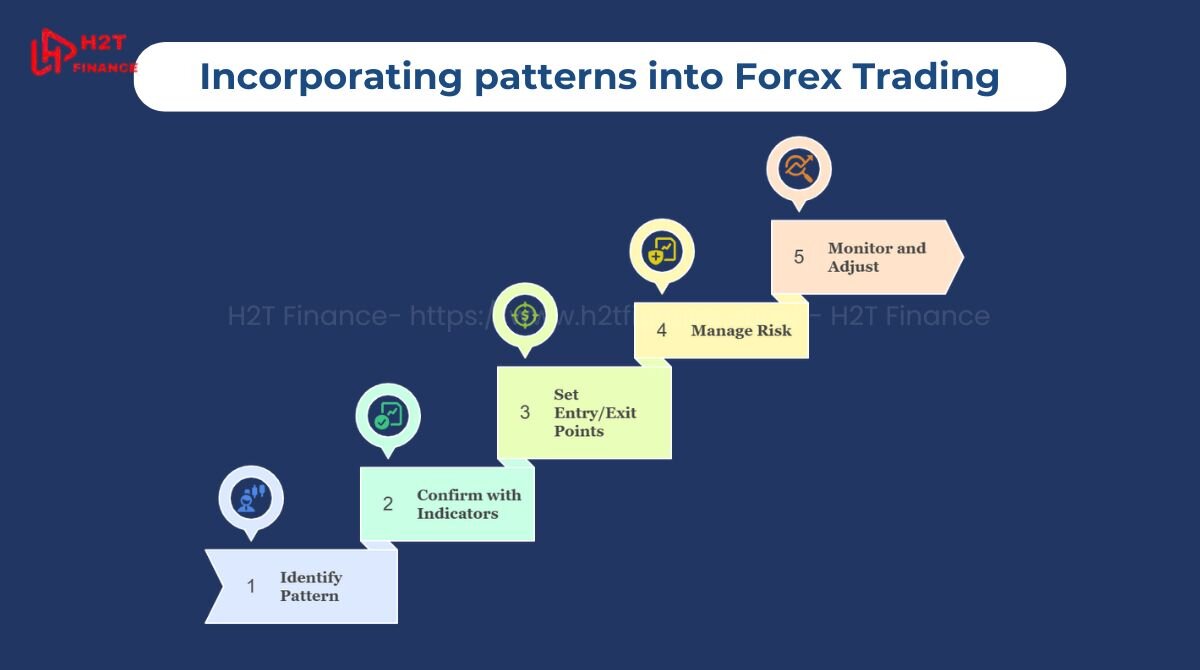
Here’s how to incorporate patterns into your forex trading strategy.
- Identify the pattern: Remember that real-world patterns are rarely as perfect as their textbook examples; they can be 'noisy' and require a degree of interpretation. Use charting tools to spot potential patterns on price charts, such as candlestick or line charts.
Popular platforms like MetaTrader 4 or TradingView make this easier with their drawing tools and indicators. For example, look for what appears to be a double bottom pattern after a downtrend to signal a potential bullish reversal.
- Confirm with indicators: Patterns alone aren’t foolproof, as 'false signals' or 'false breakouts' are a constant risk in the market. Pair them with technical indicators like the Relative Strength Index (RSI) or Moving Average Convergence Divergence (MACD) to increase the probability of a successful trade by filtering out lower-quality signals.
For instance, an RSI showing oversold conditions can support the bullish case of a double bottom pattern.
- Set entry and exit points: Use the pattern’s structure to plan trades. For a continuation pattern like an ascending triangle, enter a long position when the price breaks above the resistance line. Set exit points using take-profit levels based on historical price targets or support/resistance zones.
- Manage risk: Always apply risk management techniques, such as setting a stop-loss below the pattern’s key support level. For example, in a double bottom, place the stop-loss just below the lowest trough to limit potential losses if the reversal fails.
- Monitor and adjust: Markets are dynamic, so revisit your trade setup as new data emerges. If a pattern’s breakout stalls, reassess using additional indicators or market news to avoid false signals.
4.2. Practical example
To illustrate how trading patterns work in real-world forex trading, let’s walk through a trade setup using a double bottom pattern on the EUR/USD pair.
- Scenario: Suppose EUR/USD has been in a downtrend, reaching a support level at 1.0500 twice, forming a double bottom. The price then rises to a resistance level at 1.0600 before pulling back slightly, confirming the pattern.
- Step 1: Identify the pattern: On your charting platform, you spot the double bottom on a 4-hour chart, indicating a potential bullish reversal.
- Step 2: Confirm with indicators: Check the RSI, which shows an oversold reading below 30, supporting the bullish signal. A bullish crossover on the MACD further confirms the pattern.
- Step 3: Set entry and exit points: Enter a long position when the price breaks above the resistance at 1.0600. Set a take-profit target at 1.0700, based on the pattern’s height projected upward. Place a stop-loss at 1.0450, just below the lowest trough of the double bottom.
- Step 4: Manage risk: Calculate your risk-reward ratio, aiming for at least 1:2 (risking $50 to gain $100). Monitor the trade for unexpected market news, such as economic data releases, that could impact EUR/USD.
- Outcome: If the price reaches 1.0700, you secure a profit. If it drops to 1.0450, the stop-loss limits your loss. This disciplined approach leverages the double bottom’s purpose to time a bullish trade.
5. How do I confirm that a pattern is valid before making a trade?
Confirming the validity of a trading pattern is a critical step in forex trading to avoid false signals and improve the accuracy of your trades. This section outlines practical steps to validate trading patterns, combining technical tools, market context, and risk management to make informed decisions.
Trading patterns, while powerful, are not infallible. False breakouts or misleading formations can lead to losses if acted upon without confirmation. By following a structured process, traders can increase confidence in their pattern trading strategies, whether dealing with continuation, reversal, or bilateral patterns like ascending triangles or double bottoms.
5.1. Steps to confirm a trading pattern
To confirm that a trading pattern is valid, follow these actionable steps, which integrate technical analysis and market awareness:
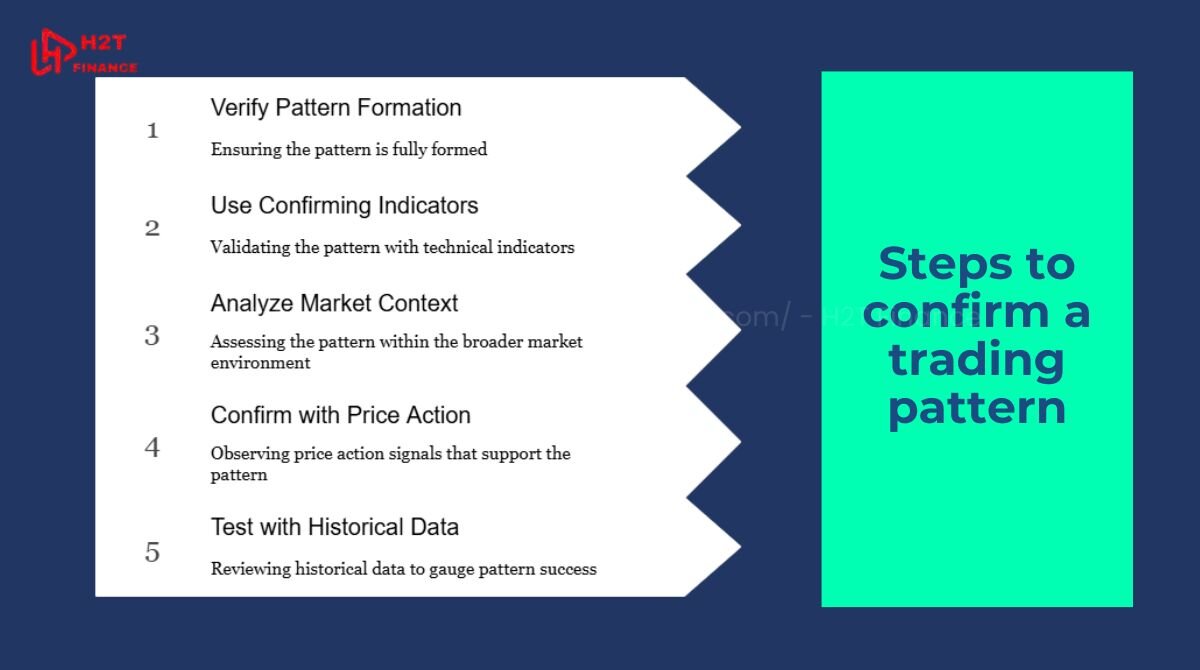
Step 1: Verify pattern formation
Ensure the pattern is fully formed before acting. For example, a double bottom requires two distinct troughs at a support level with a clear resistance breakout. Incomplete patterns, like a partially formed symmetrical triangle, are unreliable. Use charting platforms like MetaTrader 4 or TradingView to visualize the pattern’s structure clearly.
Step 2: Use confirming indicators
Pair the pattern with technical indicators to validate its signal. Common indicators include:
- Relative Strength Index (RSI): Confirms momentum. For instance, an oversold RSI below 30 supports a bullish double bottom.
- Moving Average Convergence Divergence (MACD): Validates trend shifts. A bullish crossover on MACD can confirm an ascending triangle breakout.
- Volume: Rising volume during a breakout, such as in a pennant pattern, strengthens the signal. For example, if a head and shoulders pattern forms, check for declining volume on the second shoulder to confirm a bearish reversal.
Step 3: Analyze market context
Patterns must align with the broader market environment. A reversal pattern like a double top in a strong uptrend may fail if bullish momentum persists.
Use trendlines or moving averages to assess the overall trend. Additionally, consider macroeconomic factors, such as interest rate announcements or economic data releases, that could influence currency pairs.
Step 4: Confirm with price action
Look for price action signals that support the pattern. A strong bullish candle breaking above an ascending triangle’s resistance line suggests a valid breakout. Conversely, a pin bar rejecting a double top’s resistance reinforces a bearish signal. Price action adds context to the pattern’s reliability.
Step 5: Test with historical data
Review historical charts to see how similar patterns performed in comparable market conditions. Platforms like TradingView allow you to backtest patterns, such as pennants or head and shoulders, to gauge their success rate. This step builds confidence in the pattern’s predictive power.
5.2. Practical example
Let’s walk through confirming a symmetrical triangle pattern on the GBP/USD pair to illustrate the process.
Scenario: On a 1-hour chart, GBP/USD forms a symmetrical triangle after a downtrend, with converging trendlines indicating consolidation. The price approaches the apex, suggesting a potential breakout.
- Step 1: Verify pattern formation
The triangle has clear lower highs and higher lows, fully formed over 20 candles. The pattern is visible on TradingView’s candlestick chart. - Step 2: Use confirming indicators
The RSI is neutral at 50, showing no overbought/oversold conditions, but a bullish MACD crossover occurs, hinting at upward momentum. Volume increases as the price nears the upper trendline. - Step 3: Analyze market context
The downtrend has weakened, with a 50-period moving average flattening. No major UK or US economic releases are scheduled, reducing volatility risks. - Step 4: Confirm with price action
A strong bullish candle breaks above the triangle’s upper trendline, closing decisively above resistance at 1.3500. - Step 5: Test with historical data
Historical analysis on TradingView shows symmetrical triangles in GBP/USD often lead to 50-pip moves post-breakout in similar conditions.
Trade setup: Enter a long position at 1.3510 after the breakout, set a take-profit at 1.3560 (50 pips), and place a stop-loss at 1.3470 (below the triangle’s lower trendline). This setup leverages the confirmed pattern for a favorable risk-reward ratio.
5.3. Why confirmation matters
Confirming trading patterns is crucial to reduce the risk of false signals, which are common in volatile forex markets. Without validation, traders may act on misleading formations, leading to potential losses.
By combining pattern recognition with indicators, market context, price action, and historical analysis, traders can align their strategies with what was the purpose of this trading pattern whether to ride a trend, catch a reversal, or capitalize on a breakout. This multi-layered approach ensures more reliable trade setups.
A disciplined confirmation process enhances profitability and minimizes losses. It transforms trading patterns from mere chart shapes into actionable insights, empowering traders to navigate the forex market with confidence.
6. Tools to identify trading patterns: MT4, MT5, and TradingView
Using trading patterns effectively in forex requires the right tools to spot them accurately. Platforms like MetaTrader 4 (MT4), MetaTrader 5 (MT5), and TradingView are popular choices for identifying patterns, helping traders act on insights like what was the purpose of this trading pattern.
Each platform offers unique features for pattern recognition, catering to different trading needs. This section compares MT4, MT5, and TradingView, highlighting their strengths and limitations to guide your choice.
6.1. MetaTrader 4 (MT4)
MetaTrader 4 is a widely used platform known for its simplicity and robust charting capabilities, making it a go-to tool for forex traders seeking to identify trading patterns.
- Overview: MT4 offers customizable charts and basic pattern indicators, ideal for spotting formations like double tops or ascending triangles. Its user-friendly interface suits beginners and seasoned traders alike.
- Key features for patterns:
- Supports candlestick, bar, and line charts for pattern analysis.
- Built-in drawing tools like trendlines to mark patterns manually.
- Access to custom indicators via the MQL4 community for automated pattern detection.
- Pros:
- Free to use with most forex brokers.
- Extensive community support with free pattern indicator downloads.
- Lightweight and fast, even on older devices.
- Cons:
- Limited advanced charting compared to newer platforms.
- Fewer timeframes and analytical tools than MT5 or TradingView.
- Best for: Traders who want a straightforward platform for basic pattern recognition without complex features.
6.2. MetaTrader 5 (MT5)
MetaTrader 5 builds on MT4’s foundation, offering enhanced tools for pattern analysis and a broader range of trading instruments, including forex, stocks, and commodities.
- Overview: MT5 provides advanced charting and more timeframes, enabling precise identification of patterns like head and shoulders or symmetrical triangles. It’s designed for traders needing deeper analytical capabilities.
- Key features for patterns:
- 21 timeframes (vs. MT4’s 9) for granular pattern analysis.
- Enhanced drawing tools and built-in indicators for trendlines and Fibonacci retracements.
- MQL5 marketplace offers sophisticated pattern recognition scripts.
- Pros:
- Superior charting and analytical tools for complex patterns.
- Supports multiple asset classes, ideal for diversified traders.
- Faster processing for real-time pattern detection.
- Cons:
- Steeper learning curve than MT4.
- Less widely supported by brokers compared to MT4.
- Best for: Advanced traders who need robust analytics and multi-asset trading.
6.3. TradingView
TradingView is a cloud-based platform renowned for its intuitive interface and community-driven features, making it a top choice for pattern recognition in forex and other markets.
- Overview: TradingView excels at pattern identification with automated alerts and a vast library of user-generated scripts. It’s perfect for traders who value collaboration and ease of use.
- Key features for patterns:
- Auto-pattern recognition tools that highlight formations like pennants or double bottoms.
- Customizable alerts for pattern breakouts, such as symmetrical triangle completions.
- Community scripts and forums for sharing pattern strategies.
- Pros:
- User-friendly, accessible on any device via browser or app.
- Extensive pattern library and active community support.
- Advanced charting with unlimited indicators.
- Cons:
- Some pattern recognition features require a paid subscription.
- Not a trading platform itself, requiring integration with brokers.
- Best for: Traders who prioritize ease of use, community insights, and advanced pattern alerts.
- Comparison table:
| Platform | Pattern tools | Pros | Cons |
|---|---|---|---|
| MT4 | Basic indicators, trendlines | Free, user-friendly | Limited advanced features |
| MT5 | Advanced charting, 21 timeframes | Robust analytics | Steeper learning curve |
| TradingView | Auto-pattern alerts, community scripts | Intuitive, cloud-based | Paid features |
7. Common mistakes when using trading patterns
Understanding what was the purpose of this trading pattern is crucial, but misapplying patterns can lead to costly errors in forex trading. Even experienced traders fall into traps when relying on patterns without proper context or discipline.
This section highlights common mistakes when using trading patterns and offers practical solutions to avoid them, ensuring you leverage patterns effectively in your strategies.
It's incredibly easy to get excited about patterns, but that excitement is often where costly mistakes are born. Let's be clear: these pitfalls don't just trap beginners; even seasoned traders can fall for them without disciplined awareness.
Recognizing these common traps is the first step to refining your approach, so you can use patterns for their intended purpose: providing high-probability signals, not guaranteed predictions.
7.1. Relying solely on patterns:
Many traders act on a pattern, like a double top, without confirming it with other tools. Patterns are not foolproof; false breakouts can occur. For example, a double top may form but fail if market fundamentals, like a major economic release, drive the price upward.
Solution: Always pair patterns with indicators like RSI or MACD, or check volume trends to validate signals. This ensures the pattern’s signal aligns with market momentum.
7.2. Ignoring market context:
Trading a reversal pattern, such as a head and shoulders, in a strong trend can lead to losses. Patterns must be analyzed within the broader market environment. For instance, a head and shoulders in a powerful uptrend may simply be a consolidation rather than a reversal.
Solution: Assess the overall trend using trendlines or moving averages before trading a pattern. Consider macroeconomic factors, like interest rate decisions, that could influence forex pairs.
7.3. Poor risk management:
Setting stop-losses too close to entry points or neglecting them entirely is a common error. For example, placing a stop-loss just below a double bottom’s trough without accounting for market volatility can result in premature exits.
Solution: Use a risk-reward ratio of at least 1:2 and set stop-losses based on key support/resistance levels. Adjust position sizes to limit risk to 1–2% of your account per trade.
7.4. Overtrading on unclear patterns:
Some traders force trades on ambiguous patterns, like an incomplete symmetrical triangle, leading to poor outcomes. Patterns require clear formation to be reliable.
Solution: Wait for patterns to fully form and confirm breakouts with volume or price action. Practice patience to avoid jumping into trades prematurely.
Check out other blog posts in the same category:
8. Frequently asked questions
To further clarify what was the purpose of this trading pattern and related concepts, this section addresses common questions forex traders often ask. These answers provide additional insights into trading patterns, their reliability, and practical applications, helping you deepen your understanding and refine your strategies.
Whether you’re a beginner or an experienced trader, these FAQs offer valuable guidance.
8.1. What is the purpose of trading in forex?
The purpose of trading in forex is to profit from price movements in currency pairs by buying low and selling high or selling high and buying low. Trading patterns play a critical role in achieving this goal by helping traders identify trends, reversals, and entry/exit points.
8.2. How reliable are trading patterns?
Trading patterns are reliable when used correctly but are not guaranteed predictors of price movements. Their effectiveness depends on confirmation from other tools, like indicators or volume, and the market context.
8.3. Which trading pattern is best for beginners?
For beginners, simple patterns like the double bottom or ascending triangle are ideal. These patterns are easy to spot and have clear signals. A double bottom, for example, indicates a bullish reversal with two distinct troughs at a support level, making it straightforward to identify and trade.
Tip for new traders: Start with these patterns on demo accounts to build confidence before trading live.
8.4. Can trading patterns be used in other markets?
Yes, trading patterns are versatile and applicable across markets, including stocks, cryptocurrencies, commodities, and indices. The principles of technical analysis, rooted in market psychology, remain consistent.
8.5. How do I practice identifying trading patterns?
Practice identifying trading patterns using demo accounts on platforms like MetaTrader 4, MetaTrader 5, or TradingView. Start by analyzing historical charts to spot patterns like symmetrical triangles or pennants. TradingView’s paper trading feature or MT4’s strategy tester allows you to simulate trades without risking capital.
9. Conclusion
Mastering the answer to the question "what was the purpose of this trading pattern?" is a game-changer for forex traders, turning chaotic price movements into actionable opportunities. From identifying trends and reversals to leveraging tools like MT4, MT5, and TradingView, trading patterns offer a structured path to smarter decisions.
However, always remember that the key to success lies not just in pattern recognition, but in confirming them with other indicators and disciplined risk management. This is the philosophy we emphasize here at H2T Finance.
Ready to dive deeper? Explore more in our Forex Basics category or download our free checklist of top trading patterns to keep your strategies sharp. Stay informed, trade wisely, and let H2T Finance guide your forex journey.