The forex market is a dynamic arena where price action strategies can unlock significant opportunities, and supply and demand zones are among the most powerful tools for traders. A key question many ask is what time frame is best for demand and supply indicator to optimize their trading approach?
These zones, shaped by institutional buying and selling, mark critical price levels where the market often shifts direction or accelerates.
Selecting the right time frame whether for scalping, swing trading, or long-term investing depends on your goals, schedule, and risk tolerance.
This guide explores how to align supply and demand indicators with your trading style to make well-informed decisions and elevate your market edge.
Key takeaways:
- Supply and demand zones: These are critical price levels where institutional buying or selling creates potential reversal or continuation points, offering traders high-probability setups.
- Time frame selection: Choosing the right time frame (short: 1M–30M, medium: 30M–4H, long: daily–weekly) depends on your trading style, availability, and risk tolerance, directly impacting trade frequency and decision-making.
- Multi-timeframe analysis: Combining higher time frames for zone identification with lower time frames for precise entries enhances trade accuracy and filters out market noise.
- Risk management: Effective strategies include setting precise stop losses beyond zones, targeting at least a 1:2 risk-reward ratio, and limiting risk to 1-2% per trade to protect capital.
- Complementary tools: Pairing supply and demand zones with volume analysis, moving averages, or candlestick patterns strengthens trade confirmation and improves timing.
- Common pitfalls: Avoid overly broad zones, misaligned time frames, over-reliance on automation, and poor risk management to maintain consistent trading results.
- Tailored approach: Align your time frame and strategy with your lifestyle—scalpers use short time frames, swing traders prefer medium, and long-term investors focus on daily or weekly charts.
1. What are supply and demand zones?
Supply and demand zones mark key regions on a price chart where strong buying or selling activity has previously taken place, often indicating areas where price may reverse or continue its trend. These zones reflect the imbalance between buyers and sellers, driven by institutional orders, and serve as key reference points for traders to anticipate market behavior.
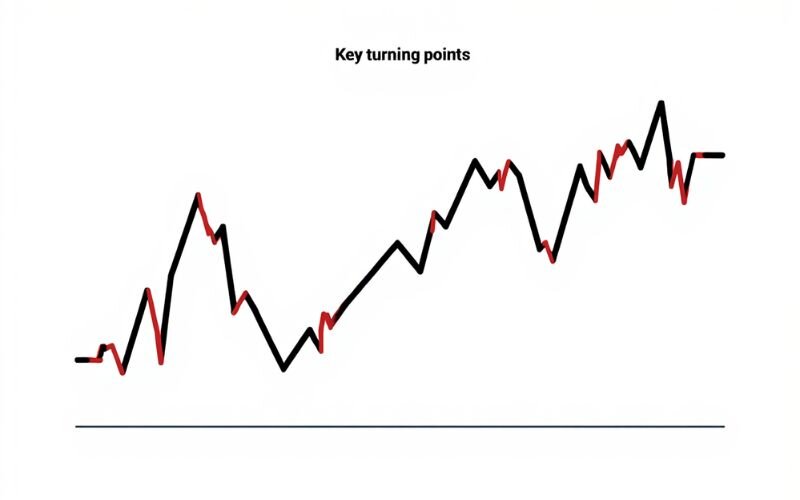
Grasping supply and demand zones is essential for building a solid foundation in price action trading within the forex market. These zones highlight areas on a price chart where significant market activity has occurred, offering clues about where prices may reverse or continue.
Unlike traditional technical indicators, supply and demand zones focus on raw price movements, making them a powerful tool for traders seeking to align with institutional activity.
- Supply zones: Supply zones refer to price levels above the current market where strong selling activity previously led to significant downward moves. They often form after a consolidation period, indicating a high number of sell orders waiting to be filled. For instance, a supply zone can form when an upward move stalls and is quickly followed by a sharp drop in price.
- Demand zones: Located below the current price, these zones mark areas where strong buying pressure triggered explosive rallies. They typically follow a consolidation phase, showing buy orders ready to push prices higher.
- Key difference from support/resistance: While similar, supply and demand zones are more dynamic. Support and resistance lines are static, but supply and demand zones are defined by consolidation before significant moves, reflecting institutional order flow.
- Why they matter: These zones reveal where “smart money” (institutional traders) is active, helping retail traders anticipate reversals or breakouts. Concentrating on these zones can enhance the accuracy of your trades and strengthen your risk management.
2. Why does time frame selection matter for supply and demand indicators?
Choosing the right time frame for supply and demand indicators is a critical decision that can make or break your forex trading strategy. Time frames determine how frequently you trade, the level of risk you face, and the speed of your decision-making process.
By aligning your time frame with your trading style and lifestyle, you can maximize the effectiveness of supply and demand zones while minimizing stress and errors.
- Impact on trade frequency and risk: Shorter time frames, like 1-minute or 15-minute charts, involve frequent trades and quick decisions, ideal for active traders but risky due to market noise. Longer time frames, such as daily or weekly charts, reduce trade frequency and offer stability.
- Alignment with trading goals: Your availability and objectives shape your time frame choice. For example, a 9-5 jobholder may struggle with 15-minute charts due to time constraints, while full-time traders can capitalize on rapid market moves.
- Enhanced accuracy with multi-timeframe analysis: Combining higher time frames (e.g., daily) for identifying zones with lower time frames (e.g., 1-hour) for entries improves precision.
- Balancing stress and opportunity: Shorter time frames can be stressful due to constant monitoring, while medium and longer time frames allow for thoughtful analysis, reducing emotional trading errors.
3. What time frame is best for demand and supply indicator in Forex trading?
Determining the best time frame for demand and supply indicators in Forex trading depends on your trading style, availability, and risk tolerance.
Supply and demand zones, as powerful price action tools, work across all time frames, but their effectiveness varies based on how you apply them.
This section explores key factors to consider when choosing a time frame, setting the stage for tailoring your strategy to your unique needs.
- Trading style drives time frame choice: Scalpers thrive on short time frames (1M–30M), swing traders prefer medium time frames (30M–4H), and long-term investors favor daily or weekly charts.
- Balancing opportunity and risk: Short time frames offer frequent trades but require constant monitoring and expose you to market noise. Medium and long time frames provide fewer but more reliable setups, reducing stress.
- Multi-timeframe synergy: Combining higher time frames for zone identification with lower time frames for entries enhances accuracy. For example, a 4H demand zone paired with a 15M entry can improve trade precision.
- Lifestyle alignment: Your daily schedule influences your choice. Part-time traders with 9-5 jobs benefit from 4H or daily charts, while full-time traders can handle 15M charts.
For a more in-depth look at price action techniques, check out our comprehensive guide to mastering price action trading. For a broader perspective on time frames, check Investopedia’s guide on Forex charting.
| Time frame | Best for | Key benefit |
|---|---|---|
| Short (1M–30M) | Scalpers, full-time traders | Frequent trade opportunities |
| Medium (30M–4H) | Swing traders, part-time traders | Thoughtful decision-making |
| Long (Daily–Weekly) | Long-term investors | Clear trend visibility |
4. Which indicator is best for supply and demand?
Traders looking for the ideal timeframe to analyze supply and demand often also seek out the most effective indicators to pair with these zones in forex trading. While supply and demand zones themselves are powerful price action tools, pairing them with indicators like volume analysis, moving averages, or candlestick patterns can enhance trade accuracy.
The best indicator depends on your trading style, but combining these tools with supply and demand zones creates a robust strategy for consistent results.
View more:
- How to trade VIX index: Strategies, tools & risk tips
- Raw spreads vs no commission: Which forex account is better?
- Forex Market Structure: Patterns, Tools & How to Read It
5. Selecting the ideal timeframe to match your trading approach
Selecting the right time frame for supply and demand indicators hinges on your trading style, lifestyle, and risk appetite. Whether you’re a scalper chasing quick profits, a swing trader balancing a day job, or a long-term investor eyeing major trends, the time frame you choose can significantly impact your success.
5.1. Short time frames (1M–30M) for scalpers and full-time traders
Scalpers and full-time traders thrive on short time frames like 1-minute to 30-minute charts, where what is the best timeframe for supply and demand aligns with frequent trade setups in supply and demand zones.

- Best for: Traders with constant market access, full-time traders who can react quickly to price movements.
- Pros:
- Frequent opportunities: Short time frames generate multiple supply and demand zones daily, ideal for high-volume trading.
- Low capital requirements: Small accounts can start trading with minimal risk per trade.
- Cons:
- High stress: Rapid price movements demand quick decisions, increasing psychological pressure.
- Market noise: Short time frames are prone to false signals, requiring precise zone identification.
- Example: A scalper might identify a 15M demand zone after a consolidation and enter on a 5M breakout, confirming with a volume spike.
5.2. Medium-term timeframes (30-minute to 4-hour) suited for swing and part-time traders
Medium time frames, such as 30-minute to 4-hour charts, suit swing traders and those with limited time, like 9-5 jobholders.
- Best for: Part-time traders who trade before or after work.
- Pros:
- Thoughtful decision-making: More time to analyze zones reduces emotional trading errors.
- Flexible scheduling: Fits around daily routines, requiring less screen time than scalping.
- Cons:
- Moderate capital needed: a $10,000 account could yield 12% monthly returns ($1,200) with proper risk management.
- Reduced trade frequency: Setups occur less often compared to lower timeframes.
- Example: A swing trader might mark a 4H supply zone and enter on a 30M reversal pattern.
5.3. Long time frames (Daily–Monthly) for long-term investors
Daily, weekly, or monthly charts are ideal for long-term investors focusing on major market trends and institutional zones.
- Best for: Investors seeking stable, low-frequency trades.
- Pros:
- Low stress: Less need for constant monitoring, allowing relaxed analysis.
- Better trend clarity: Daily and weekly levels frequently reflect institutional trading behavior.
- Cons:
- Higher capital requirements: Larger accounts are needed for significant returns due to fewer trades.
- Limited opportunities: Trades occur less often, requiring patience.
- Example: An investor might use a daily chart to spot a demand zone at a key level, refining entry on a 4H chart.
| Trading style | Time frame | Pros | Cons |
|---|---|---|---|
| Scalping/Full-time | 1M–30M | Frequent trades, low capital | High stress, market noise |
| Swing/Part-time | 30M–4H | Thoughtful decisions, flexible | Moderate capital, fewer trades |
| Long-term investing | Daily–Monthly | Low stress, clear trends | High capital, limited trades |
6. Applying multi-timeframe analysis to supply and demand trading
Multi-timeframe analysis is a powerful technique that enhances the effectiveness of supply and demand indicators by combining insights from different chart time frames.
By identifying major zones on higher time frames and refining entries on lower time frames, traders can improve trade accuracy and filter out false signals.
- Why multi-timeframe analysis works: Higher time frames (e.g., 4H, daily) reveal significant supply and demand zones driven by institutional orders, while lower time frames (e.g., 15M, 30M) provide precise entry points.
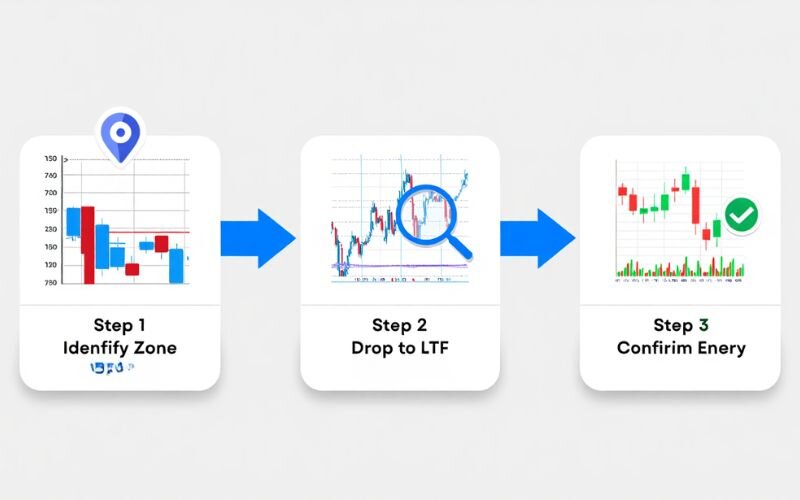
- Step-by-step process:
- Identify zones on a higher time frame (e.g., 4H or daily) where price consolidated before a sharp move.
- Switch to a lower time frame (e.g., 15M or 30M) to find entry signals, such as breakouts or reversal patterns within the zone.
- Confirm with additional signals, like volume spikes or candlestick patterns, to validate the trade setup.
- Benefits:
- Filters out market noise: Higher timeframes help eliminate minor price movements, leading to more dependable zone identification.
- Improves precision: Lower time frames pinpoint optimal entry and exit points, enhancing risk-reward ratios.
- Example: A trader marks a demand zone on a 4H chart after a consolidation and rally, then switches to a 15M chart to enter on a breakout with a bullish engulfing pattern.
- Practical tip: Start with daily or 4H charts for major zones, then use 1H or 15M charts for entries.
7. Managing risk effectively when trading supply and demand zones
Effective risk management is the cornerstone of successful supply and demand trading, ensuring you protect your capital while maximizing profit potential.
By applying disciplined strategies, traders can leverage the high-probability setups of supply and demand zones while minimizing losses.
- Set precise stop losses: Place stop losses just beyond the farthest edge of the supply or demand zone to account for market volatility. This protects against unexpected price swings while keeping losses manageable.
- Target favorable risk-reward ratios: Aim for a minimum 1:2 risk-reward ratio, with high-probability setups offering up to 1:10. For example, risking 0.5% of your account on a trade with a 1:10 ratio can yield a 5% gain, offsetting multiple small losses.
- Limit risk per trade: Cap risk at 1-2% of your account balance per trade, to ensure a single loss doesn’t derail your strategy. This approach aligns with long-term profitability, even with a mix of wins and losses.
- Use multi-timeframe confirmation: Confirm zones on higher time frames (e.g., daily) before entering on lower time frames (e.g., 1H), to reduce the risk of false breakouts.
- Example: A trader risks 0.5% on a 4H demand zone trade with a 1:10 risk-reward ratio. Even if nine subsequent trades lose 0.5% each, the initial win keeps the account in profit.
| Trade number | Risk % | Risk-reward ratio | Profit/loss % | Cumulative account change |
|---|---|---|---|---|
| 1 | 0.5% | 1:10 | +5% | +5% |
| 2 | 0.5% | N/A | -0.5% | +4.5% |
| 3 | 0.5% | N/A | -0.5% | +4% |
8. Common pitfalls traders face with supply and demand indicators
While supply and demand indicators offer powerful insights for forex trading, missteps in their application can undermine your strategy. Avoiding common mistakes ensures you maximize the effectiveness of these zones and maintain consistent results.
- Drawing zones too broadly: Overly wide zones reduce precision, making it harder to pinpoint entry and exit points. Focusing on the candles just before sharp price reversals to draw tight, accurate zones. For example, a supply zone should capture only the consolidation before a swift drop, not the entire price range.
- Misaligning time frames: Using conflicting time frames for zone identification and trade execution can lead to premature entries or late exits.
- Placing too much trust in automation: Tools such as LuxAlgo can help identify zones. Manual confirmation using price action and volume analysis is crucial to validate zones and avoid false signals.
- Ignoring risk management: Failing to set proper stop losses or chasing low risk-reward ratios can erode profits. Always risk no more than 1-2% per trade and target at least a 1:2 ratio to stay profitable.
9. Combining supply and demand with other technical tools
Combining supply and demand indicators with additional technical tools can greatly enhance the precision of your forex trading approach.
By integrating complementary indicators, you can confirm the strength of zones, filter out false signals, and improve trade timing.
- Using volume to confirm zones: Sharp increases in volume at supply or demand levels often signal significant institutional involvement. Using volume profile tools, you can identify high-volume nodes that confirm a zone’s reliability, ensuring trades align with significant market interest.
- Moving averages for trend confirmation: Aligning supply and demand zones with moving averages, such as the 50-period moving average, helps validate the prevailing trend. For example, a demand zone coinciding with a 50-period MA in an uptrend strengthens the case for a buy setup.
- Candlestick patterns for entry precision: Look for reversal patterns like bullish engulfing or pin bars within a demand zone on a lower time frame (e.g., 15M), to time entries accurately after identifying zones on a higher time frame (e.g., 4H).
- Manual confirmation over automated tools: While tools like LuxAlgo can assist in spotting zones, it needs manual confirmation through price action and volume to avoid over-reliance. This ensures robust setups tailored to your trading style.
- Practical example: A trader identifies a 4H demand zone with a volume spike, confirms it aligns with the 50-period MA, and enters on a 15M bullish engulfing pattern, combining insights from all three authors for a high-probability trade.

10. Frequently asked questions
To further clarify how to choose the best time frame for demand and supply indicators, this section addresses frequently asked questions from forex traders.
10.1. Which timeframe is most effective for trading supply and demand zones?
The best time frame depends on your trading style and availability. Scalpers and full-time traders benefit from short time frames (1M–30M) for frequent setups. Swing traders and part-time traders prefer medium time frames (30M–4H) for balanced analysis, while long-term investors use daily or weekly charts for major trends.
10.2. How do I combine time frames for better trade setups?
Multi-timeframe analysis is key to improving trade accuracy. Identify supply and demand zones on higher time frames (e.g., 4H or daily) to spot institutional activity, then use lower time frames (e.g., 15M or 30M) for precise entries.
10.3. Is it possible to combine supply and demand zones with other technical indicators?
Absolutely, integrating supply and demand zones with tools such as volume analysis, moving averages, or candlestick patterns can improve the reliability of trade setups.
10.4. How do I avoid common mistakes in supply and demand trading?
Avoid drawing zones too broadly, misaligning time frames, or over-relying on automated tools. Focus on tight zones based on consolidation candles, align higher and lower time frames for cohesive signals, and confirm setups manually.
Read more:
- Bullish vs Bearish Markets : What They Mean for Forex Traders
- What does NFP stand for? Definition and why it matters in finance – Expert’s insight
11. Conclusion: Finding the right time frame for your supply and demand trading
Mastering what time frame is best for demand and supply indicator is the key to unlocking consistent success in forex trading.
By tailoring your time frame to your trading style whether scalping on 15-minute charts, swing trading on 4-hour setups, or investing with daily trends you can maximize the precision of supply and demand zones while minimizing risks.
At H2T Finance, our blog’s mission is to empower traders with actionable knowledge, tools, and strategies through our comprehensive Forex Basics category. As a platform dedicated to delivering high-value, neutral content, we focus on building your trading expertise without pushing brokerage accounts.