The Average Body Range (ABR) is the average distance between a candle’s open and close prices over a set period, offering traders a sharper lens into real market momentum.
If you've been wondering what is the average body range in trading, this article gives you the complete answer: what it is, how it works, and how to use it to increase your success rate by over 70%.
1. What is a trading range?
Before diving into the Average Body Range (ABR), it’s important to understand the broader concept of a trading range.
A trading range refers to the horizontal movement of an asset’s price between a defined high and low over a period of time. During this phase, the market lacks a clear trend it neither moves upward nor downward significantly. Traders often describe this as “sideways” movement.
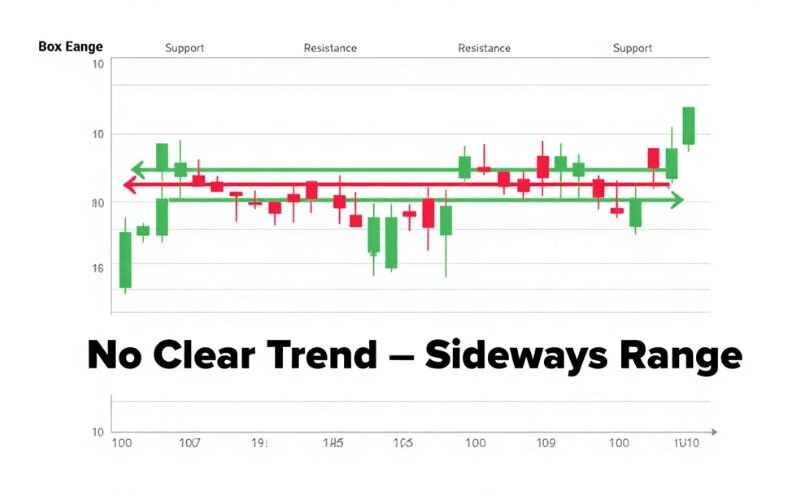
This range-bound behavior typically reflects indecision among buyers and sellers. Prices fluctuate within the boundaries of support (the lower edge) and resistance (the upper edge), until a breakout occurs in either direction.
Recognizing when the market is in a trading range is crucial because:
- It helps avoid false trend signals.
- It allows traders to shift strategies (e.g., mean reversion or range-trading techniques).
- It sets the context for evaluating real momentum — which is where the Average Body Range becomes a powerful complementary tool.
2. What is the average body range in trading? A complete explanation of this important indicator for beginners
The Average Body Range (ABR) is a technical indicator that calculates the average size of the real body of candlesticks over a selected number of periods. The real body is the distance between the open and close prices of a candle, which reflects the actual price movement during that period.
Unlike indicators such as the ATR, which include extreme wicks (highs and lows), the ABR focuses only on the part of the candle where real trading decisions occurred. This makes it a more practical tool for evaluating true market momentum.
3. Why the average body range matters for traders
In forex and financial markets, traders who focus on precision often achieve more consistent profits and avoid unnecessary losses. Yet many beginners overlook a key concept: learning what the average body range in trading really means.
This simple yet powerful indicator sheds light on how far prices are really moving between opening and closing within each candle, offering a realistic view of market strength and momentum.
By the end of this guide, you'll understand what is the average body range in trading, how to calculate and read it, and how to apply it effectively to improve your entry timing, manage risks, and sharpen your trading strategy.
4. Why focus on the real body instead of the full range?
Because the full candle range can be distorted by volatility spikes or one-off news events. By analyzing only the candle's body, ABR gives you a purer look at consistent buying or selling pressure. In short, it filters out the noise and shows you how committed the market is to a direction.
Whether you're trading forex, stocks, or crypto, understanding what is the average body range in trading can give you a clearer picture of the market’s behavior and help identify whether a trend is truly gaining traction.
View more:
- How Margin Works in Forex Trading: A Complete Guide
- 9 Best Trading App In World for 2025: Top Picks From Experts
- What Is A Margin Call? Causes and How to Avoid It
5. How to calculate the ABR
Calculating the Average Body Range is refreshingly simple:
Formula:
ABR = Average of |Close - Open| over N periods
Where:
- "Close" is the closing price of each candle.
- "Open" is the opening price.
- "N" is the number of periods (default is usually 14).
Example calculation (3 candle example):
Let's say you want to calculate a 3-day ABR. Here are the candlestick values:
- Day 1: Open = 1.2000, Close = 1.2050 → Body = 50 pips
- Day 2: Open = 1.2100, Close = 1.2080 → Body = 20 pips
- Day 3: Open = 1.2150, Close = 1.2185 → Body = 35 pips
ABR = (50 + 20 + 35) / 3 = 35 pips
This tells you that, on average, the market is moving 35 pips between open and close, a valuable insight into actual momentum.
6. What does ABR tell you about the market? Why is this indicator crucial to a trader’s success journey?
The ABR is not just a number; it's a lens into market conviction. Here's what it reveals:
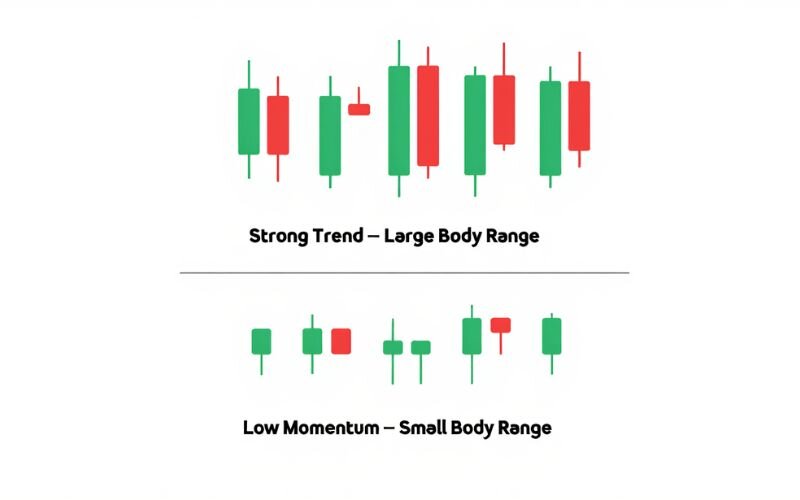
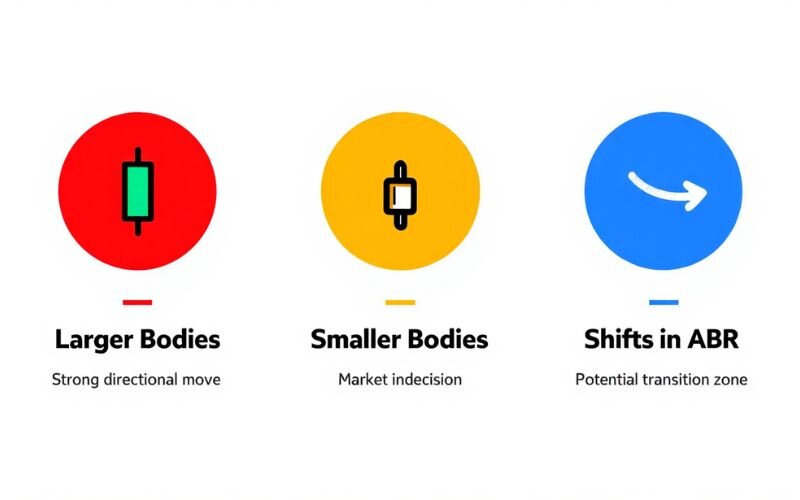
- Larger bodies = Strong directional moves. If the average body is increasing, it means traders are committing to a direction, showing higher conviction.
- Smaller bodies = Market indecision. A shrinking ABR may indicate that neither buyers nor sellers are in control. This is often a sign of consolidation or range trading.
- Shifts in ABR = Transition zones. A sudden expansion or contraction in the ABR can signal a change in trend strength or momentum.
Experienced traders often look at ABR to confirm breakouts. If the price breaks a key level but the body remains small, the breakout may lack conviction.
7. How to use ABR in real trading? Learn what is the average body range in trading through practical examples
Once you understand the theory behind ABR, it's time to put it into practice. Here's how professional traders (including myself) use ABR in everyday strategies:
- Entry Timing: Use ABR to identify when price movement is gaining strength. For instance, if the ABR is increasing during a breakout, it's a green light to enter with confidence.
- Daily Range Expectations: I personally use a 200-period ABR on the daily chart to estimate the average expected move in a day. If the ABR is 80 pips, I plan my trades around that expected range to avoid overestimating the move.
- Stop Loss and Take Profit Planning: ABR helps determine realistic stop-loss levels. If ABR = 40 pips, placing a 10-pip stop might get hit by normal fluctuations.
- Trend Strength Confirmation: Combine ABR with RSI or volume. For example, a rising ABR + RSI above 60 signals strong bullish momentum.
7.1. Reading and interpreting ABR values
Traders who understand what is the average body range in trading, especially ABR values, can make confident decisions:
- High ABR: Indicates strong buying/selling pressure. These are moments when price tends to follow through.
- Low ABR: Implies a calm or indecisive market. Ideal for mean reversion or wait-and-see setups.
7.2. Best settings for ABR
Your ABR period setting depends on your trading style:
- 14-period ABR: Good for short-term and swing traders to track current volatility trends.
- 50-period ABR: Offers a smoother view for longer setups.
- 200-period ABR (my favorite): Excellent for setting daily range expectations. Helps avoid chasing unrealistic price targets.
You can customize this on most charting platforms like TradingView or MetaTrader using custom indicators named "Average Candle Body" or "Real Body Range".
8. Where can you find ABR indicators? Make the right choice to make the right decision
If you're ready to try using what is the average body range in trading, you can find it easily. While it's not a default indicator on most platforms, custom versions of the Average Body Range (often labeled as "Average Candle Body" or "Real Body Range") are available on popular tools like:
| Platform | How to Find / Use ABR Indicator | Notes |
| TradingView | Go to the Indicators section and search for community scripts named "Average Candle Body" or "Candle Body Range." Many developers share free versions with adjustable periods. | Period settings can be customized. |
| MetaTrader (MT4/MT5) | Find downloadable custom indicators on forums like MQL5.com by searching for ABR or use a script that measures average candle body size. | Indicators must be downloaded and installed manually. |
| NinjaTrader & Thinkorswim | These platforms support scripting; you can code a simple ABR indicator or browse user libraries and communities for plug-and-play versions. | Requires scripting skills or community resources. |
Whatever platform you use, make sure to backtest the indicator with your existing strategy. A good tool doesn't replace sound analysis; it enhances it.
9. Common mistakes beginners make with ABR
Even though ABR is simple to understand, misusing it can still lead to poor decisions. Here are the most common pitfalls:
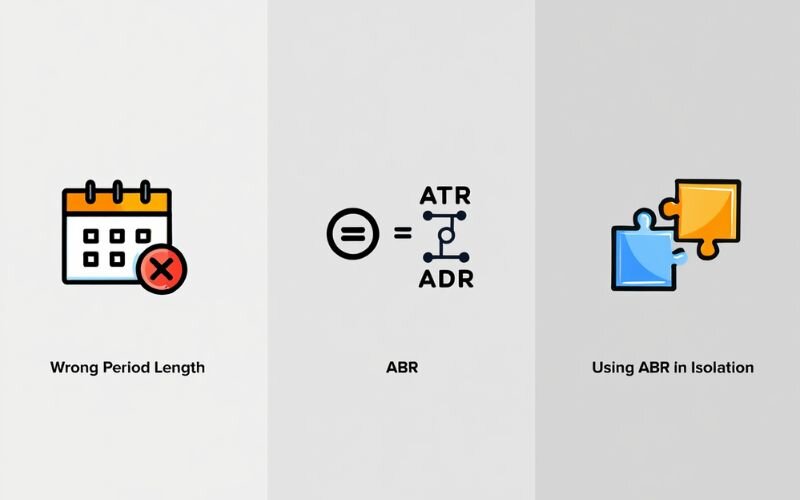
- Choosing the wrong period length: Using a period that’s too short (e.g., 3 or 5 candles) can make ABR too sensitive, while overly long settings (e.g., 500+) may smooth out useful signals.
- Confusing ABR with ATR or ADR: Remember, ABR only measures the real body (Open to Close). It's not the same as ATR, which includes shadows or wicks.
- Using ABR in isolation: No indicator should be used alone. Always combine ABR with support/resistance levels, price action, or volume for context.
Understanding these mistakes upfront saves you time, energy, and money in your trading journey.
10. FAQs: Common questions when searching for what is the average body range in trading
10.1. How is ABR different from ATR or ADR?
While ATR and ADR include wicks and full price ranges, ABR focuses strictly on the candle’s body. That means it reflects only real trading action, what traders truly
committed during that period.
10.2. What’s the best ABR setting for day traders?
For intraday or short-term strategies, a 14-period ABR gives a responsive view of price momentum. It tracks current volatility without being too noisy, perfect for scalpers and swing traders.
10.3. Can ABR predict market reversals or breakouts?
ABR alone won’t predict reversals, but rising ABR during a breakout confirms strong momentum. Combine it with volume or RSI for high-conviction entries or exits.
10.4. Is ABR a good indicator for beginners?
Yes, ABR is simple to understand and apply, especially for new traders. It shows you how much price is truly moving from open to close, without getting distracted by wicks or fake volatility spikes.
10.5. How often should I update the ABR period setting?
Your ABR period should match your trading timeframe. Day traders may stick with 14 or 20 periods, while position traders might prefer 50 or 200. Adjust only when your strategy or market conditions change.
Read more:
- What is stop limit order? The risk management secret and trading mastery tip from experts
- How does forex trading work? Learn the basics today
11. Conclusion: Should you add ABR to your trading toolkit?
At this point, you understand what the average body range in trading is, how it works, how to calculate it, and most importantly, how to apply it directly to your strategy. This indicator gives you a more grounded perspective on market momentum by focusing on what matters most: the conviction between open and close.
ABR can improve your timing, reduce false signals, and help you stay within realistic expectations of price movement. When paired with volume or RSI, it becomes even more powerful for confirming trend strength.
If you're serious about becoming a more consistent trader, adding ABR to your toolkit is a smart, data-driven move.
Now that you understand what is the average body range in trading, don't stop here. Explore more in our Forex Basics category on H2T Finance to deepen your strategy, sharpen your tools, and elevate your trading success.