Have you ever felt confused by the market's ups and downs, unsure of when a trend truly begins and when it's just a fakeout? If the answer is yes, then the first thing you need to do is understand what is a break of structure in trading.
This isn't just some fancy term; it's the core of the Smart Money Concept (SMC) method, helping us 'read' how the 'big players' or financial institutions are driving the game. It's the key to shifting from trading on a whim to analyzing with logic and following the big money flow.
In this article, we will dissect BOS together from A to Z—from how to identify it, its different types, to how to build a complete trading strategy so you can navigate the market with more confidence.
Key takeaways:
- Definition of BOS: A Break of Structure (BOS) is a price movement that surpasses a previous swing high or low, confirming trend continuation in forex trading, signaling the strength of buyers (bullish BOS) or sellers (bearish BOS).
- Core to Smart Money Concept (SMC): BOS helps traders follow institutional price action, identifying how large players like banks drive market trends, crucial for logical trading decisions.
- Types of BOS: Includes bullish BOS (breaking swing highs in uptrends), bearish BOS (breaking swing lows in downtrends), and false BOS (fakeouts that reverse quickly, requiring confirmation to avoid traps).
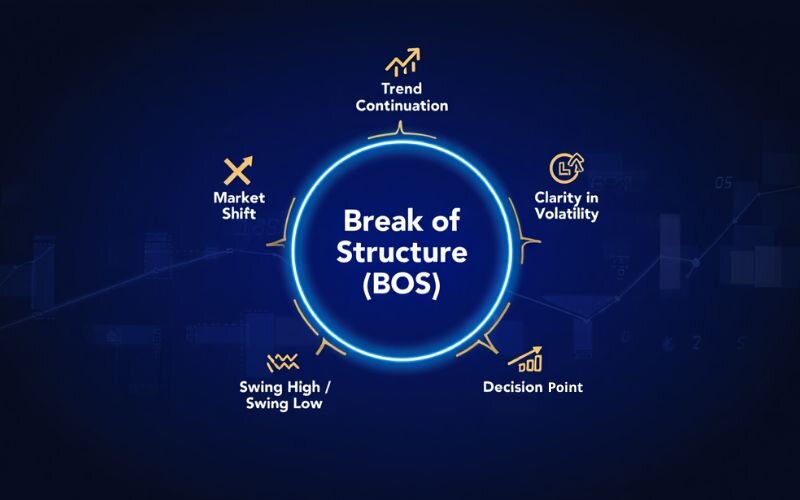
- Importance in trading: BOS provides clarity in volatile markets, guiding entry points, stop-loss placement, and trend identification, enhancing confidence and discipline.
- Identification methods: Use price action (e.g., engulfing candles), trend lines, swing points, and indicators like Moving Averages, MACD, RSI, and Bollinger Bands to confirm BOS.
- Trading strategy: Enter trades on confirmed BOS with pullbacks (e.g., Fibonacci levels), set stop losses below/above swing points, and target profits at key levels or order blocks.
- Avoiding mistakes: Common errors include trading without confirmation, ignoring volume, setting tight stop losses, or trading minor BOS against major trends.
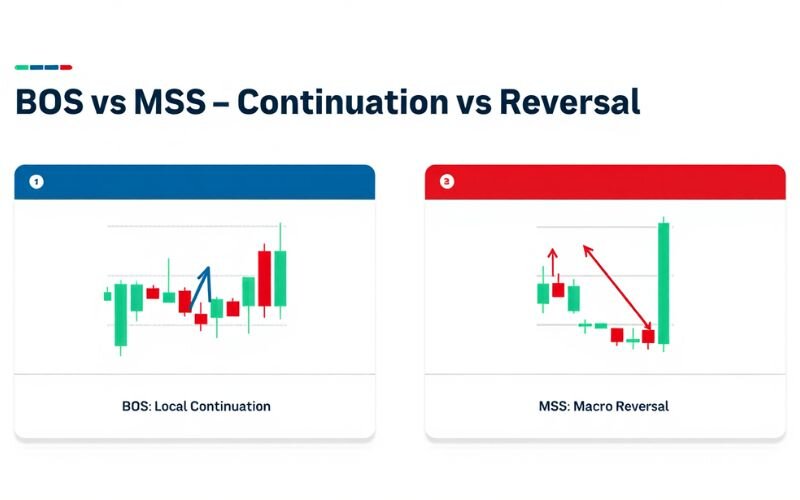
- BOS vs. other concepts: Unlike BOS (trend continuation), a Market Structure Shift (MSS) signals trend reversal, while a Change of Character (ChoCh) indicates potential reversals by breaking strong swing points.
- Versatility: BOS applies to forex, stocks, cryptocurrencies, and commodities, making it a universal tool for trend-following traders.
- Tools for success: Platforms like MetaTrader 4/5 and TradingView, combined with SMC tools like order blocks and free resources from H2T Finance, enhance BOS trading accuracy.
1. What is a break of structure in trading?
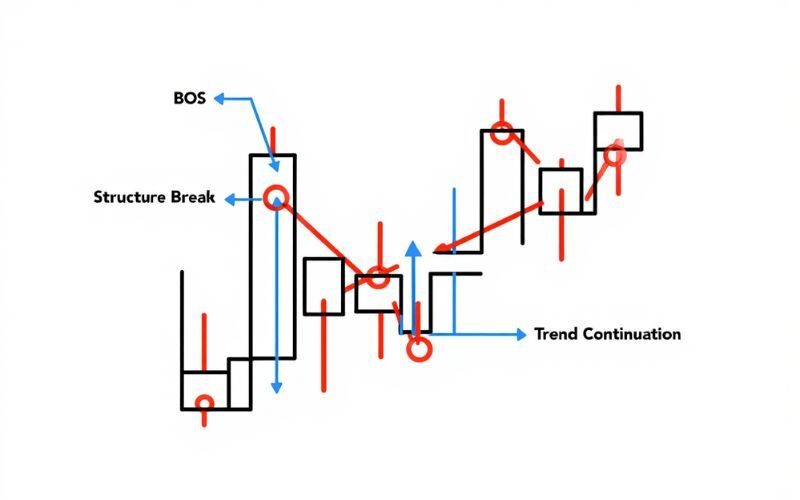
In the simplest terms, a Break of Structure (BOS) is when the market gives you a clear signal saying: "Hey, I still want to go in this direction!". In an uptrend, it's the moment the price shows its strength by pushing past the old high to create a new higher high.
Conversely, in a downtrend, it's when the sellers dominate and push the price to break the old low to find a new lower low. This isn't a random fluctuation; it's a statement about the strength of the ongoing trend.
Unlike random price fluctuations, a true BOS reflects a significant shift in market sentiment, driven by institutional buying or selling.
In the context of Smart Money Concept (SMC), BOS is used to analyze how large players, like banks, influence price action.
For example, in an uptrend, a BOS happens when the price surpasses a prior peak, confirming bullish strength without breaking the last low. This pattern is especially relevant in forex due to the market’s high volatility, where pairs like EUR/USD frequently form clear swing points.
BOS is also central to the Inner Circle Trader (ICT) methodology, which emphasizes market structure and liquidity zones. By spotting a BOS, traders can anticipate trend continuation and avoid premature reversals.
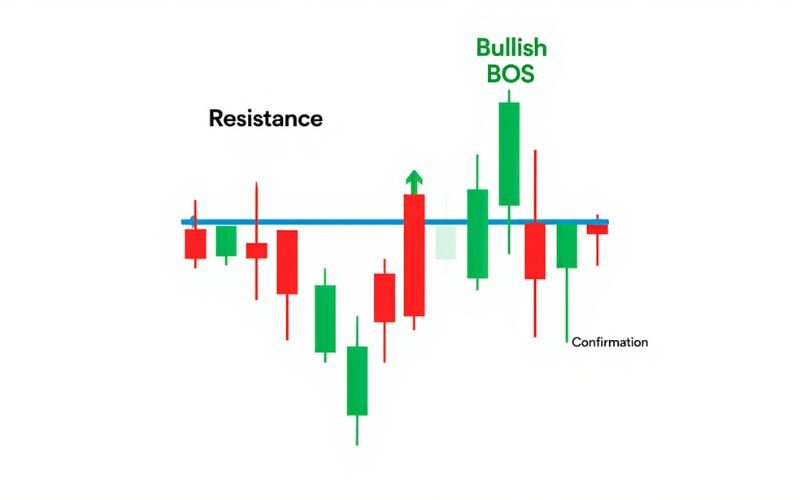
Imagine you're watching the GBP/JPY pair, and you see it struggling around the 190.50 resistance level. Many traders might be selling here, thinking the price will reverse. But then, a strong bullish candle appears, pushing the price to close decisively above 190.50. That is a BOS.
At this moment, the market isn't just breaking a barrier; it's "engulfing" all the previous sell orders and showing that the buyers are in complete control, as long as the last significant low remains intact.
To visualize this, imagine a chart where price forms higher highs and higher lows. A BOS occurs when a new high exceeds the previous peak, reinforcing the uptrend. This clarity makes BOS a favorite among forex traders aiming for precise trade setups.
2. What is a broken market structure?
A broken market structure refers to a disruption in the established pattern of price movements within a trend, signaling a shift in market dynamics.
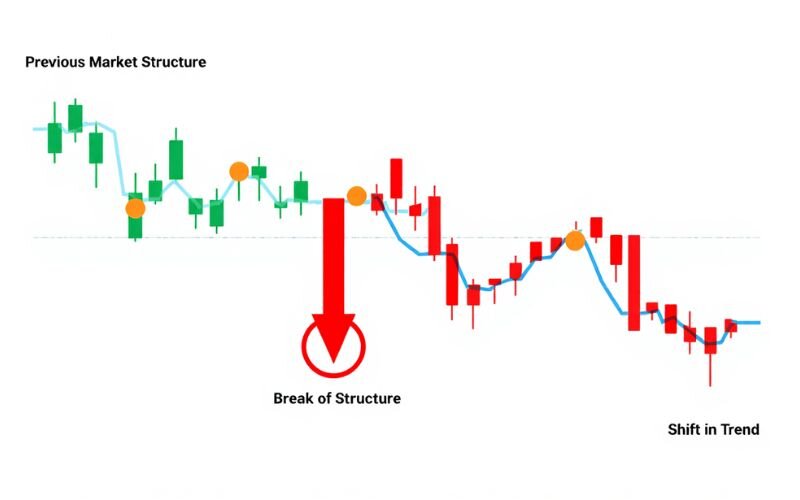
In the context of forex trading and Smart Money Concept (SMC), a market structure is defined by the sequence of swing highs and lows that form an uptrend (higher highs and higher lows) or a downtrend (lower highs and lower lows).
When this structure is "broken," it indicates that the price has violated a key swing point, such as a swing high in a downtrend or a swing low in an uptrend, potentially altering the trend’s direction or confirming its continuation.
A Break of Structure (BOS) is a specific type of broken market structure that reinforces the existing trend. For example, in an uptrend, a bullish BOS occurs when the price breaks above a previous swing high, confirming that buyers remain in control and the uptrend is intact.
Conversely, in a downtrend, a bearish BOS happens when the price drops below a prior swing low, signaling continued seller dominance. This breaking of the market’s previous structure, such as surpassing a resistance or support level, is what traders identify as a BOS.
However, not all broken market structures result in a BOS. A more significant break, such as a Change of Character (ChoCh) or Market Structure Shift (MSS), can indicate a potential trend reversal rather than continuation.
For instance, if EUR/USD in an uptrend fails to make a higher high and instead breaks below a key swing low, it may signal a bearish shift, breaking the bullish market structure entirely. Understanding the difference between a BOS and other forms of broken market structures is crucial for traders to accurately interpret market signals and avoid misjudging trend direction.
By analyzing broken market structures, traders can better anticipate whether the market will continue its current trajectory or prepare for a potential reversal, using tools like price action, swing points, and indicators to confirm their analysis.
View more:
- How to exclude hline from autofit pricescale on an indicator
- Round numbers above and below indicator MT4 explained
- How to fix missing allow modification of signal MT5 error?
3. Types of break of structure in trading
Understanding the different types of Break of Structure (BOS) is crucial for traders aiming to capitalize on market trends. BOS can signal whether a trend is gaining strength or if a potential trap lies ahead. By recognizing these variations, you can make informed decisions in forex trading and beyond.
This section breaks down the three main types of BOS bullish, bearish, and false each offering unique insights into market sentiment. These distinctions help traders align their strategies with the prevailing trend or avoid misleading signals. Let’s dive into each type to see how they work in practice.
3.1. Bullish BOS
A bullish Break of Structure occurs when the price of a currency pair breaks above a previous swing high, often a resistance level, in an uptrend. This movement signals that buyers are in control, pushing the market to new highs and confirming the trend’s strength.
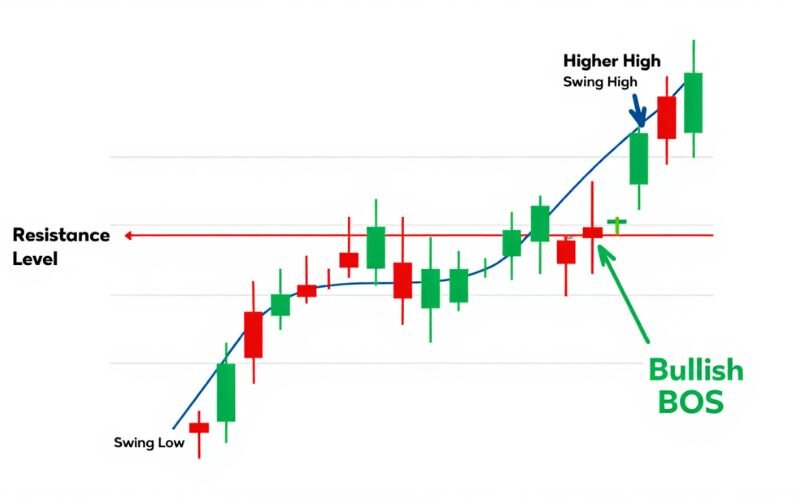
For example, if EUR/USD breaks above a resistance at 1.1250, forming a higher high without violating the last swing low, it indicates a bullish BOS. Traders can use this signal to enter long positions, expecting further upward momentum. Confirming the break with a strong candlestick close or a retest of the broken level adds confidence to the trade setup.
3.2. Bearish BOS
In contrast, a bearish BOS happens when the price falls below a previous swing low, typically a support level, in a downtrend. This suggests that sellers have taken over, driving the market to new lows and reinforcing bearish momentum.
For instance, if USD/JPY drops below a support at 145.00, creating a lower low while respecting the prior high, it marks a bearish BOS.\
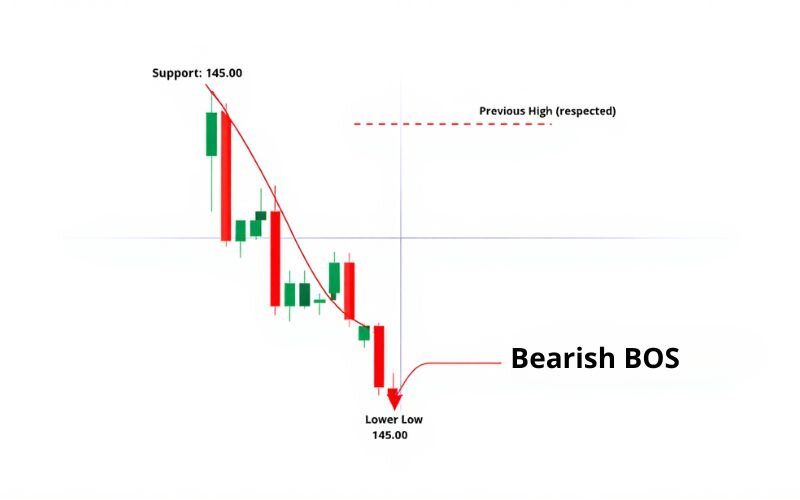
Traders might consider short positions, using tools like trend lines or volume to validate the break. Setting a stop loss above the broken support helps manage risk in case the trend reverses unexpectedly.
3.3. False BOS and how to avoid it
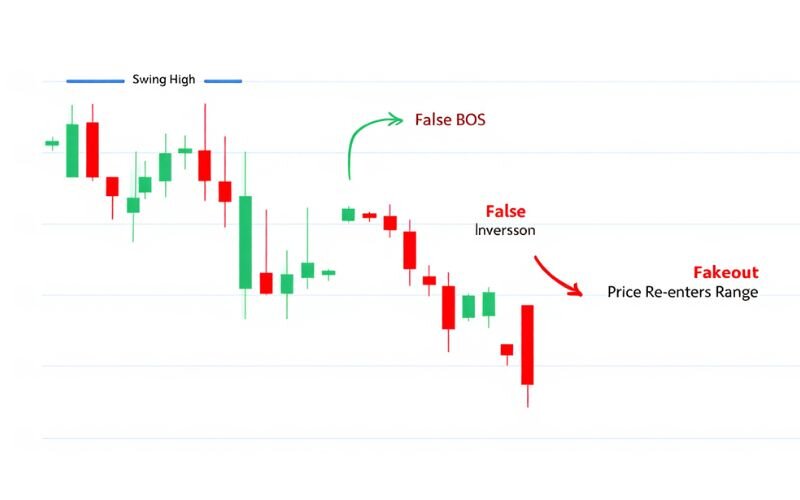
This is the classic 'trap,' the nightmare that every trader has fallen into at least once. You see the price just break a key high, you rush into a buy order... and then 'boom,' the price reverses even faster than it went up, leaving you 'stuck' at the top.
That is a False BOS, or 'fakeout.' Often, this is a trick used by the 'sharks' to sweep the crowd's stop losses before pushing the price in the opposite direction. So how do you avoid becoming a victim?
Be patient. Never act just because the price 'touched' a level. Wait to see how that candle closes, or even better, wait for the price to retest the broken zone. Patience will save your capital.
For example, if GBP/USD appears to break a resistance but reverses without a clear close, it’s likely a fakeout. Checking volume or using indicators like RSI can help filter out these false signals.
4. Why is break of structure important in trading?
A Break of Structure (BOS) is more than just a technical signal it’s a powerful tool that helps traders navigate the complexities of forex markets. By pinpointing moments when a trend is likely to continue, BOS offers clarity in a fast-moving environment.
So why is identifying a BOS so critical? Because it transforms the chaos of a chart into an orderly story. Instead of guessing, you'll have a clear roadmap for trend identification.
You'll know where the potential zones are to enter a trade without 'catching a falling knife,' and most importantly, you'll know where to place your stop loss logically to protect your account. Whether you're scalping on the 5-minute chart or swing trading for weeks, BOS is the foundation upon which you build confidence and discipline in every decision.
BOS also connects to other SMC concepts, like liquidity zones and order blocks, offering a deeper understanding of market dynamics. By mastering BOS, traders gain a reliable framework for consistent decision-making.
5. Break of Structure Indicators
To effectively confirm a Break of Structure (BOS) in trading, leveraging technical indicators can enhance your analysis and reduce the risk of acting on false signals. These indicators, rooted in Smart Money Concept (SMC) principles, provide quantitative support to validate price action and ensure robust trade setups.
Below is a list of key indicators commonly used to confirm BOS in forex trading, applicable to pairs like EUR/USD, GBP/JPY, or AUD/JPY.
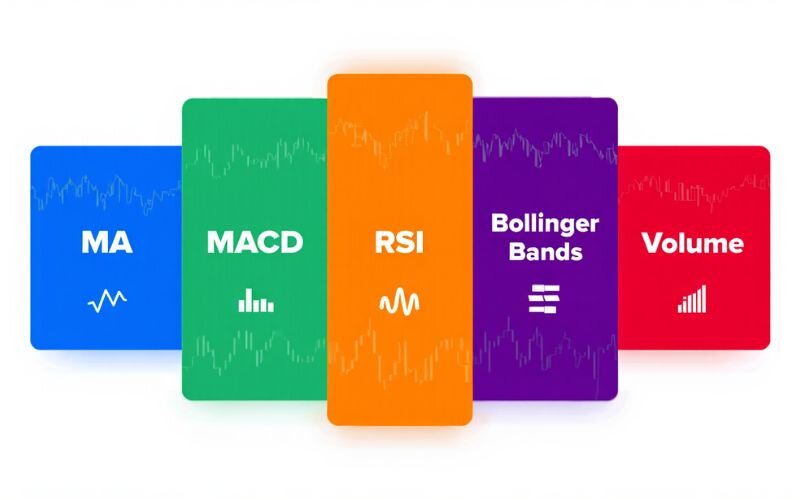
- Moving Averages (MA): Moving Averages help smooth price data and confirm trend direction. A bullish BOS is supported when a short-term MA (e.g., 20-period) crosses above a long-term MA (e.g., 50-period) after a break above a swing high. For example, on a USD/CAD chart, this crossover can validate bullish momentum.
- MACD (Moving Average Convergence Divergence): The MACD indicator measures momentum. A bullish BOS is confirmed when the MACD line crosses above the signal line following a break of a swing high. Conversely, a bearish BOS aligns with a MACD line crossing below the signal line after breaking a swing low.
- RSI (Relative Strength Index): RSI gauges overbought or oversold conditions. A bullish BOS is strengthened when RSI rises above 50 or approaches 70 after a break, indicating strong buyer momentum. For a bearish BOS, an RSI below 50 or nearing 30 supports the downward trend, as seen in pairs like USD/JPY.
- Bollinger Bands: These bands measure volatility and highlight significant price moves. A bullish BOS is confirmed when the price breaks above the upper Bollinger Band, signaling strong upward momentum. For a bearish BOS, a break below the lower band indicates seller dominance, useful for pairs like AUD/USD.
- Volume: Strong volume accompanying a BOS confirms institutional participation. For instance, a high-volume break above a resistance on GBP/USD strengthens the reliability of a bullish BOS, while low volume may suggest a potential fakeout.
By combining these indicators with price action analysis, traders can confirm BOS with greater confidence. Always use multiple indicators to cross-verify signals and avoid relying on a single tool, ensuring a disciplined approach to trading volatile forex markets.
6. How to identify a Break of Structure in trading
Identifying a Break of Structure (BOS) in trading is essential for traders aiming to capitalize on trend continuation. By understanding what is a break of structure in trading, you can pinpoint key moments when the market signals a strong move.
This section explores practical methods to spot BOS in real-time, using price action, trend analysis, swing points, and technical indicators. These techniques, rooted in Smart Money Concept (SMC) principles, are particularly effective in forex trading due to the market’s dynamic nature.
Whether you’re analyzing AUD/USD or XAU/USD, these tools will help you confirm BOS with confidence.
6.1. Price action and candlestick patterns
Price action is a direct way to identify a BOS. Look for candlestick patterns like engulfing candles or pin bars that signal a break past a swing high or low. For example, a bullish engulfing candle closing above a resistance on EUR/GBP suggests a bullish BOS, indicating buyer strength.
These patterns reflect market sentiment in real-time, allowing traders to act without relying solely on lagging indicators. Always confirm the break with a strong close to avoid misinterpreting temporary spikes.
6.2. Trend lines and channels
Trend lines and channels are visual tools that highlight BOS effectively. Draw trend lines connecting recent highs or lows to define the market’s direction. A BOS occurs when the price breaks through these lines, signaling a trend shift.
For instance, in an uptrend, if USD/CAD breaks above an ascending trend line, it confirms a bullish BOS. Channels, which enclose price within parallel lines, further clarify breaks when price exits the range. These tools help traders visualize BOS within the broader market structure.
6.3. Swing points analysis
Swing points analysis is central to identifying what is a break in trading. In SMC, swing points are classified as strong (likely to hold) or weak (likely to break). A bullish BOS occurs when price surpasses a weak swing high in an uptrend, forming a new high without breaching the last low.
Conversely, a bearish BOS involves breaking a weak swing low in a downtrend. For example, if GBP/USD forms a higher high above 1.3000, it confirms a bullish BOS. Focus on strong closes past these points for reliability.
6.4. Indicators for confirmation
Technical indicators add quantitative support to BOS identification. Consider these tools:
- Moving Averages: A short-term MA (e.g., 20-period) crossing above a long-term MA (e.g., 50-period) aligns with a bullish BOS, as seen in AUD/JPY charts.
- MACD: A MACD line crossing above the signal line after a BOS confirms momentum.
- RSI: Readings above 70 (bullish) or below 30 (bearish) validate BOS strength.
- Bollinger Bands: Price breaking above the upper band signals a bullish BOS with high volatility.
These indicators reduce the risk of acting on false breaks, ensuring robust trade setups.
7. How to identify fake breaks of structure?
Fake breaks of structure, often referred to as "fakeouts," are deceptive price movements that briefly surpass a swing high or low but quickly reverse, trapping impulsive traders. Identifying these false signals is critical to avoid losses and maintain a disciplined trading approach.

Rooted in Smart Money Concept (SMC) principles, this section outlines practical methods to spot fake BOS in forex trading, helping you stay cautious when analyzing pairs like EUR/USD or GBP/JPY.
- Lack of Candlestick Confirmation: A true BOS requires a strong candlestick close beyond the swing point, such as a bullish engulfing candle for an uptrend. A fake BOS often shows weak closes, like a doji or a wick-heavy candle that fails to sustain the break. For example, if USD/JPY briefly breaks above 145.00 but closes below it with a long upper wick, it signals a potential fakeout.
- Low Volume Support: Volume is a key indicator of institutional participation. A fake BOS typically occurs with low volume, indicating a lack of commitment from large players. For instance, a break above a resistance on EUR/GBP with declining volume suggests a liquidity grab rather than a genuine trend continuation.
- No Retest or Follow-Through: A legitimate BOS often sees price retest the broken level (e.g., a swing high turning into support) before continuing the trend. Fake breaks lack this retest, with price quickly reversing back into the prior range. For example, if GBP/USD breaks a resistance at 1.3000 but immediately drops without retesting, it’s likely a fake BOS.
- Divergence in Indicators: Technical indicators can reveal fakeouts. For instance, if the RSI shows bearish divergence (lower highs in RSI while price makes a higher high) during a supposed bullish BOS on AUD/USD, it warns of a potential reversal. Similarly, a MACD failing to confirm momentum can signal a fake break.
- Liquidity Zones and Market Context: Fake BOS often occurs in liquidity zones where institutional traders hunt stop-losses. For example, a break above a major swing high on USD/CAD that aligns with a cluster of stop-losses may be a trap. Always analyze the broader market context, such as nearby order blocks or high-impact news events, to gauge the break’s validity.
To avoid fake BOS, wait for confirmation through strong candlestick closes, sustained volume, and indicator alignment. Practice identifying these patterns on a demo account, using platforms like TradingView, to sharpen your ability to distinguish genuine BOS from traps in volatile forex markets.
8. Break of Structure trading strategy
Developing a trading strategy around a Break of Structure (BOS) can help traders capitalize on trend continuation while managing risk effectively. This section outlines a practical BOS trading strategy, focusing on entry points, stop-loss placement, take-profit targets, and complementary tools.
Rooted in Smart Money Concept (SMC) principles, this approach is ideal for forex traders seeking to align with institutional price action. By understanding what is a break of structure in forex trading, you can create a disciplined plan to trade pairs like EUR/USD or USD/JPY with confidence. Let’s explore the key components of a BOS strategy.
8.1. Entry points
To enter a BOS trade, wait for a confirmed break of a swing high (bullish) or swing low (bearish). Use Fibonacci retracement to identify pullback levels 38.2%, 50%, or 61.8% where price often pauses before resuming the trend.
For example, in a bullish BOS on AUD/USD, if the price breaks above 0.6800, enter at the 50% retracement level around 0.6750 after a pullback. Confirm the entry with a strong candlestick close or a retest of the broken level to ensure the trend’s strength. This approach maximizes the risk-to-reward ratio.
8.2. Stop loss
Setting a stop loss is critical to protect against unexpected reversals. In a bullish BOS, place the stop loss just below the last swing low before the break, typically 5–10 pips below the new support.
For a bearish BOS, position it above the last swing high. For instance, in a bearish BOS on GBP/JPY breaking below 190.00, set the stop loss at 190.50. This placement limits losses while allowing room for market fluctuations. Always risk no more than 1–2% of your account per trade to maintain discipline.
8.3. Take profit
Take-profit targets depend on the trend’s potential and key market levels. Aim for prior swing highs (bullish) or lows (bearish), or use Fibonacci extensions (e.g., 161.8%) for larger moves. Alternatively, scale out by taking partial profits at multiple levels.
For example, in a bullish BOS on EUR/GBP, take 50% profit at the next resistance (0.8600) and let the rest run to 0.8700.
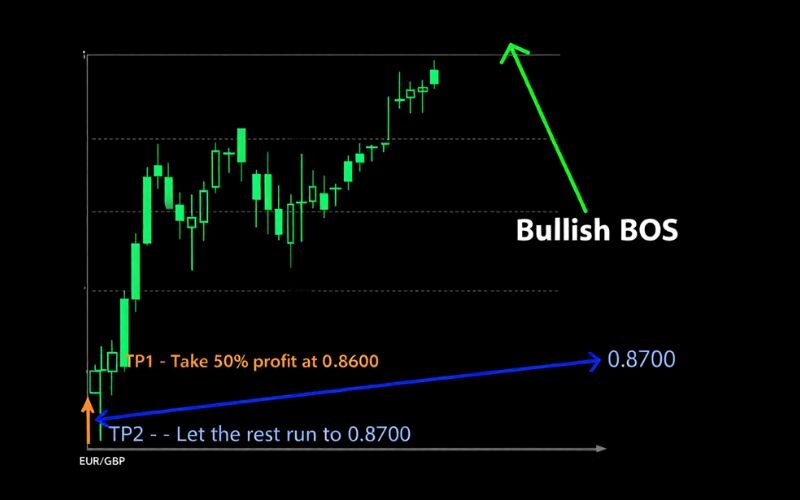
Order blocks, where institutional orders cluster, can also serve as take-profit zones. This strategy balances reward with prudent exit planning.
8.4. Complementary tools
Enhance your BOS strategy with SMC tools like order blocks and imbalances. Order blocks are areas where price pauses before continuing, often aligning with BOS entries or exits. Imbalances, or fair value gaps, are price gaps likely to be filled before the trend resumes.
For instance, if a bullish BOS on USD/CAD aligns with an order block at 1.3600, it strengthens the trade setup. Combine these with indicators like MACD or RSI for confirmation. Platforms like TradingView offer robust charting for spotting these patterns.
9. What is the difference between a market structure shift and a break of structure?
Understanding the distinction between a Market Structure Shift (MSS) and a Break of Structure (BOS) is essential for precise trading decisions in forex markets. Both concepts, rooted in Smart Money Concept (SMC), involve price movements around swing points but signal different market outcomes.
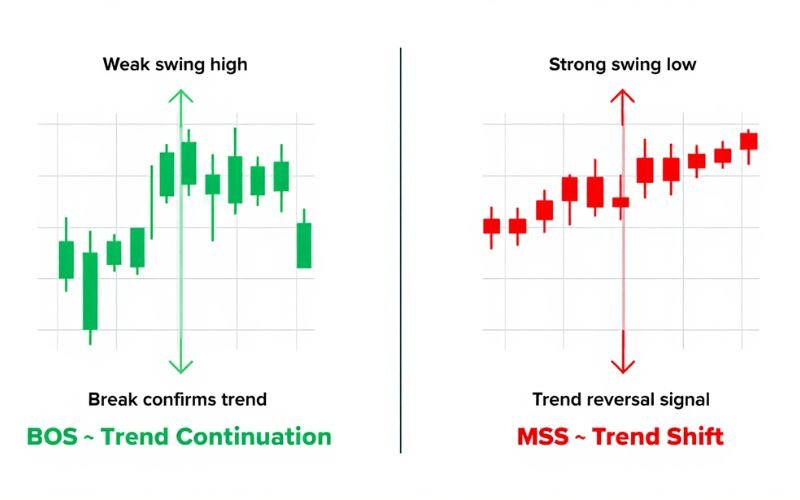
A Break of Structure (BOS) confirms the continuation of an existing trend by breaking a weak swing point. In an uptrend, a bullish BOS occurs when the price surpasses a previous swing high, reinforcing buyer control (e.g., EUR/JPY breaking above 165.00).
In a downtrend, a bearish BOS happens when the price drops below a prior swing low, confirming seller dominance (e.g., USD/JPY breaking below 145.00). BOS indicates that the current trend remains intact and is likely to persist, making it a key signal for traders aligning with market momentum.
In contrast, a Market Structure Shift (MSS) signals a potential reversal of the broader trend, marking the start of a new trend direction. MSS occurs when the market fails to make a new high in an uptrend or a new low in a downtrend, followed by a strong break of a significant swing point with an impulse move, known as displacement.
For example, if USD/CHF in an uptrend forms a lower high and breaks below a key support, it indicates a bearish MSS, suggesting a shift to a downtrend. Unlike BOS, which supports the existing trend, MSS requires multiple confirmations and careful analysis across timeframes to validate the trend change.
To easily distinguish them, picture the trend as a train running on a track. A Break of Structure (BOS) is like the train passing a small station (a weak high/low) and continuing its journey without changing direction.
In contrast, a Market Structure Shift (MSS) is like the train receiving a signal, slowing down, and then switching to a completely different track to start a new journey in the opposite direction. BOS is a confirmation of continuation, while MSS is a warning of a major change.
For instance, a bullish BOS on GBP/USD at 1.3000 confirms upward momentum, but if the price later fails to make a higher high and breaks below a key low, it could signal an MSS toward a bearish trend. By recognizing these differences, traders can avoid misinterpreting signals and align their strategies with the market’s true direction.
10. Common mistakes when trading Break of Structure
Trading a Break of Structure (BOS) can be highly effective, but missteps can lead to costly errors, especially in the fast-paced forex market. Understanding what is a break of structure in trading helps, but applying it correctly requires avoiding common traps.
This section highlights frequent mistakes traders make when using BOS and offers practical tips to stay on track. By recognizing these pitfalls, you can refine your approach and trade with greater confidence, whether you’re analyzing USD/CHF or XAU/USD.
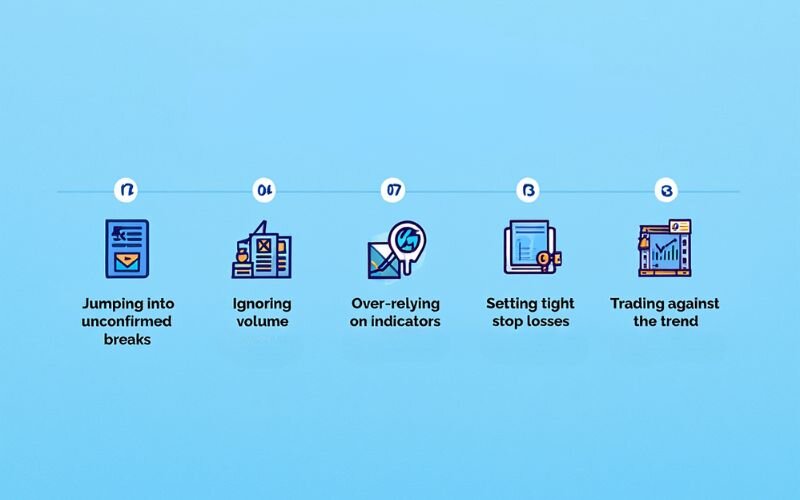
Understanding the theory of BOS is one thing, but avoiding deadly mistakes in live trading is another entirely. Many traders have 'burned their accounts' because of seemingly small errors: they were too eager to enter a trade the moment the price broke without waiting for confirmation, they ignored the warning signs from weak trading volume, or they set their stop losses so tight they were 'swept' out by minor market noise.
And the most critical mistake of all is trying to use a minor BOS signal to trade against the prevailing major trend. Remember, BOS is a tool to go with the flow, not to fight against it.
To avoid these errors, combine price action with indicators and volume analysis. Practice on a demo account to test BOS setups before risking capital.
11. Break of Structure vs. other market concepts
Understanding what is a break of structure in trading is only part of the puzzle knowing how it differs from related concepts like Change of Character (ChoCh) and Market Structure Shift (MSS) is crucial for precise trading decisions.
These Smart Money Concept (SMC) terms often confuse traders, as they involve price movements around swing points but signal different outcomes. This section compares BOS with ChoCh and MSS to clarify their roles in forex trading, helping you avoid misinterpretations when analyzing pairs like EUR/JPY or USD/CHF.
11.1. BOS vs. Change of Character (ChoCh)
A Break of Structure (BOS) signals trend continuation by forming a new high in an uptrend or a new low in a downtrend, reinforcing the current market direction. For example, if EUR/JPY breaks a swing high at 165.00, it confirms bullish momentum.
In contrast, a Change of Character (ChoCh) indicates a potential trend reversal by breaching a strong swing point, such as a key support in an uptrend. If EUR/JPY falls below a strong low at 162.00, it suggests a bearish ChoCh. Recognizing this difference helps traders distinguish between continuing trends and possible reversals.
11.2. BOS vs. Market Structure Shift (MSS)
While BOS focuses on local trend continuation, a Market Structure Shift (MSS) signals a broader trend reversal with multiple confirmations. MSS occurs when the market fails to make a new high (in an uptrend) or low (in a downtrend) and breaks a strong swing point with a strong impulse move, called displacement.
For instance, if USD/CHF forms a lower high and breaks below a key support, it indicates an MSS toward a downtrend. Unlike BOS, which supports the existing trend, MSS marks the start of a new trend direction, requiring careful analysis across timeframes.
12. Tools to enhance BOS trading
To effectively trade a Break of Structure (BOS), leveraging the right tools can make a significant difference in your forex trading success. From charting platforms to educational resources, these tools help traders identify and confirm BOS with precision.
This section explores how platforms like MetaTrader 4 (MT4), MetaTrader 5 (MT5), and TradingView enhance BOS trading, alongside free resources available to traders. By using these tools, you can better understand what is a break of structure in trading and apply it to pairs like AUD/JPY or NZD/USD.
- MetaTrader 4 (MT4): A widely used platform, MT4 offers reliable indicators like MACD and RSI for BOS confirmation. Its customizable charts are ideal for spotting swing points and candlestick patterns, though it lacks advanced community features.
- MetaTrader 5 (MT5): An upgraded version of MT4, MT5 provides enhanced charting tools and faster execution, perfect for analyzing BOS across multiple timeframes. It supports complex indicators and is suited for intermediate traders.
- TradingView: Known for its user-friendly interface and vibrant community, TradingView excels in drawing trend lines and channels to identify BOS. Its free version offers robust charting, making it accessible for beginners and pros alike.
- Free resources: H2T Finance provides guides and eBooks on BOS and SMC strategies. Demo accounts on MT4 or TradingView allow risk-free practice of BOS setups, helping you refine your skills.
These platforms, combined with educational content, empower traders to execute BOS strategies effectively. Explore TradingView’s free tools or MT4’s demo to start practicing today.
Check out more blog posts in the same category:
13. Frequently Asked Questions (FAQs)
To fully grasp what is a break of structure in trading, traders often have follow-up questions about its application and nuances. This FAQ section answers key queries about BOS, its differences from other concepts, and its use across trading styles and markets.
These concise answers provide clarity for intermediate forex traders looking to deepen their understanding of BOS strategies.
13.1. What is a break in trading?
A break in trading refers to the price moving past a significant level, such as support or resistance, often signaling a Break of Structure (BOS). In forex, a break occurs when a currency pair like USD/CAD surpasses a swing high or low, indicating trend continuation. Confirming the break with a strong close is crucial to avoid false signals.
13.2. How does BOS differ from ChoCh in forex trading?
A Break of Structure (BOS) confirms trend continuation by breaking a weak swing point, like a new high in an uptrend (e.g., EUR/USD at 1.1300).
Conversely, a Change of Character (ChoCh) suggests a potential reversal by breaching a strong swing point, such as a key support, signaling a shift in market direction.
13.3. Can BOS be used in day trading?
Yes, BOS is effective for day trading on lower time frames, like 5-minute or 15-minute charts. For instance, a bullish BOS on GBP/USD can signal quick entries for short-term trades. Its versatility makes it ideal for fast-paced forex markets, provided traders confirm breaks with price action or indicators.
13.4. What indicators confirm a Break of Structure?
Indicators like Moving Averages, MACD, RSI, and Bollinger Bands confirm BOS. For example, a short-term MA crossing above a long-term MA supports a bullish BOS on AUD/JPY. RSI above 70 or a price breaking the upper Bollinger Band adds confidence to the trend’s strength.
13.5. Is BOS only for forex trading?
No, BOS applies to multiple markets, including stocks, cryptocurrencies, and commodities. While popular in forex due to high volatility in pairs like NZD/USD, BOS is equally effective for identifying trend continuation in assets like gold or tech stocks, making it a versatile tool.
13.6. What Is the Difference Between BOS and MSS?
A Break of Structure (BOS) confirms trend continuation by breaking a weak swing point, such as a new high in an uptrend (e.g., EUR/JPY at 165.00), reinforcing the current market direction.
In contrast, a Market Structure Shift (MSS) signals a broader trend reversal, occurring when the market fails to make a new high or low and breaks a strong swing point with a strong impulse move, called displacement (e.g., USD/CHF breaking below a key support after forming a lower high).
14. Conclusion
Through this article, we hope you not only understand what is a break of structure in trading, but also feel its power in bringing clarity to every trading decision. Mastering BOS will help you know when to patiently follow the trend and when to be wary of the market's traps.
The journey to conquer the financial markets is a long one that requires continuous learning. And at H2T Finance, we are committed to being your partner on that journey, providing the most neutral and practical knowledge. To reinforce the solid foundation you've built today, we highly recommend exploring more articles in our Forex Basics category.