The USD vs Euro graph is more than just a tool for financial traders. It offers a comprehensive overview of the economic health of the United States and the Eurozone, two of the world's leading economic powerhouses.
Understanding the euro vs usd exchange rate graph provides you with valuable insights into international markets, whether you're planning a trip, making an investment, or are simply curious about how currencies fluctuate. This guide will help you decode the information presented on the usd vs eur graph.
1. What is the USD vs Euro graph?
Essentially, the USD vs euro graph is a visual representation of the exchange rate between the United States Dollar (USD) and the Euro (EUR). This chart shows you the value of one currency relative to the other at any given time.
When the line on the graph moves upward, it means the dollar is strengthening against the euro. Conversely, when the line moves downward, the euro is gaining strength. As EUR/USD is the world's most traded currency pair, analyzing the currency graph usd vs euro is not just for speculation; it also provides a snapshot of economic strength, investor sentiment, and the stability of these two major economic zones.
2. Why the USD vs Euro graph exchange rate matters
The USD vs Euro graph isn’t just a tool for traders, it represents the economic heartbeat of two of the largest financial zones in the world: the Eurozone and the United States. The exchange rate between the euro and the dollar plays a crucial role in shaping global trade, investment flows, and economic policy decisions.
As the most traded currency pair globally, the EUR/USD accounts for more than 20% of all Forex transactions. This high level of activity means the exchange rate is constantly monitored and analyzed by central banks, institutional investors, and even governments.
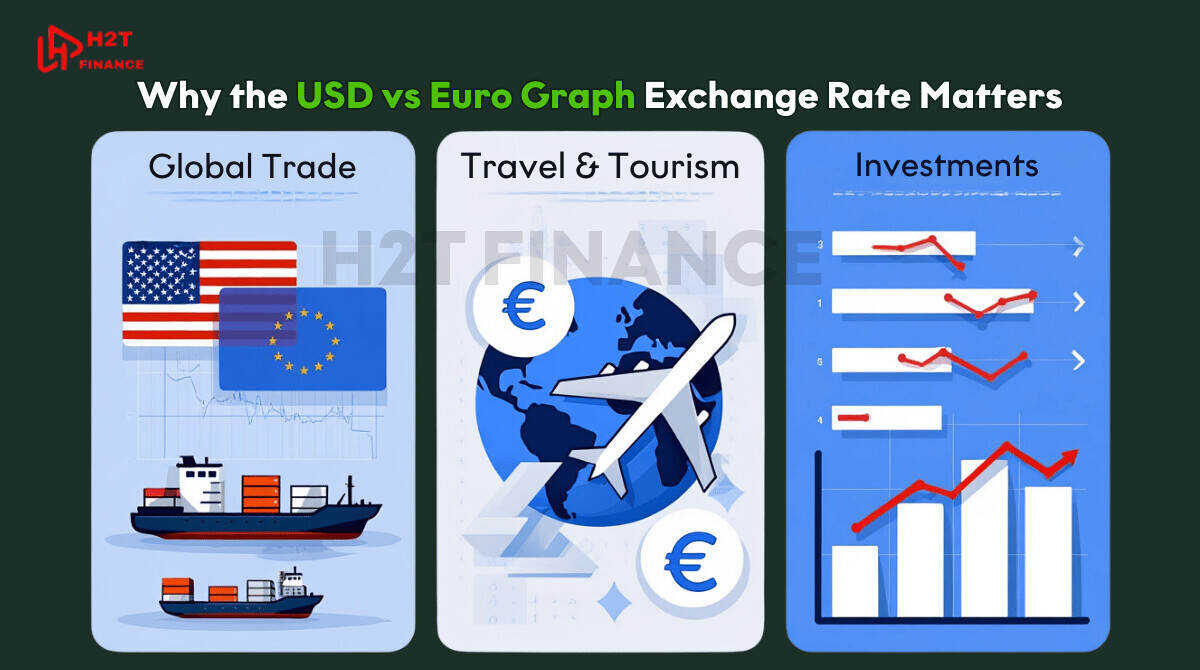
A small shift in this rate can affect everything from multinational corporate earnings to how much you pay for goods imported from Europe.
The strength of the euro against the dollar or vice versa also impacts:
- Import and export prices: A stronger dollar can make European goods cheaper for U.S. buyers, while a weaker dollar has the opposite effect.
- Travel and tourism: A favorable rate means more spending power abroad.
- Investment decisions: Exchange rate trends help determine where capital flows, especially in bond and equity markets.
Both the European Central Bank (ECB) and the U.S. Federal Reserve (Fed) closely monitor the EUR/USD pair. Their decisions on interest rates, inflation targets, and monetary policy often lead to significant movement in the euro vs USD graph.
For anyone interested in global economics or just trying to understand why currencies rise and fall, the EUR/USD exchange rate is a perfect starting point.
3. How to read the USD vs Euro graph as a beginner
For newcomers to Forex or international finance, the USD vs Euro graph can look intimidating at first. But with a basic understanding of how it works, reading and interpreting this chart becomes straightforward and highly useful.
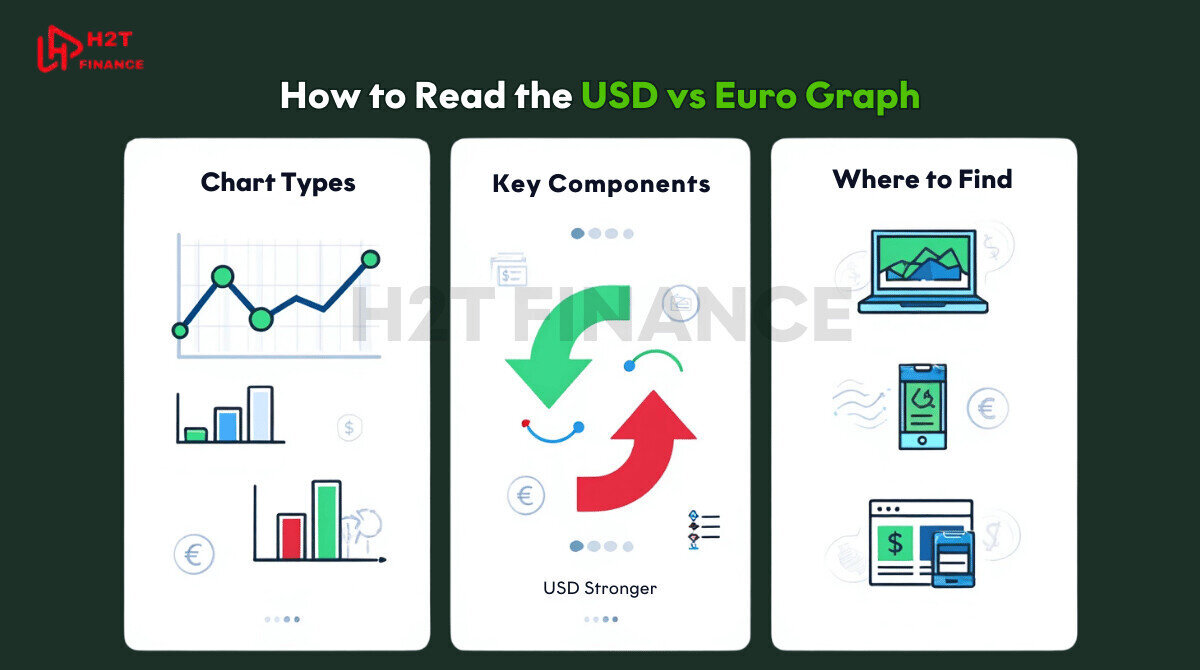
At its core, this graph tracks how the euro performs against the U.S. dollar over time. The vertical axis (y-axis) typically shows the exchange rate how many U.S. dollars one euro can buy while the horizontal axis (x-axis) represents the time frame, which could range from minutes to decades.
Before diving into strategy or predictions, it's important to recognize the types of charts commonly used in Forex:
3.1. Common chart types
- Line chart: This is the most straightforward format and your best starting point. It's perfect for seeing the bigger picture and identifying long-term trends on the euro vs USD dollars graphs, as it simply connects the closing prices over a period.
- Bar chart: Displays opening, high, low, and closing prices within a selected time frame. It provides more detail for those who want to understand price fluctuations.
- Candlestick chart: A favorite among traders for a good reason. Each “candle” not only shows price movement over a set period but also helps you visualize market sentiment and volatility.
3.2. Key components to understand
- Time frames: Short-term (e.g., 1-minute, 1-hour) charts are better for day trading, while longer-term (daily, weekly, monthly) charts suit investment or trend analysis.
- Price direction: An upward-sloping graph indicates the euro is strengthening against the dollar. A downward slope suggests the opposite.
3.3 Where to find reliable USD vs Euro graph
Several trusted tools can help beginners access these charts:
- TradingView: Offers interactive candlestick charts with customizable technical indicators.
- XE.com: Provides clean, historical line charts that are easy to read and perfect for long-term trend analysis.
- X-Rates: Useful for quick daily exchange rate snapshots and simple comparisons.
Platforms like TradingView also help newcomers learn how to read currency exchange charts effectively.
These allow you to adjust the timeframe and chart type to better suit your goals whether you're checking daily rates or studying economic history.
Understanding the USD vs Euro graph gives you more than just numbers. It reveals the relationship between two economic giants and gives context to everything from your travel expenses to global financial news.
4. Live vs historical USD vs Euro graph
Understanding the difference between live and historical currency charts is essential for interpreting the USD vs Euro graph effectively. Each type of chart serves a unique purpose and offers valuable insights depending on your trading goals or level of experience.
While both live and historical charts track the exchange rate between the U.S. dollar and the euro, they differ in terms of data resolution, use cases, and time horizons.
4.1. Live USD vs Euro graph: real-time insights
Live charts update in real time, often by the second or minute. They are most useful for:
- Short-term traders looking to capitalize on rapid price movements.
- Scalping or day trading strategies, where even minor fluctuations are critical.
- Reacting to breaking news, central bank statements, or macroeconomic reports.
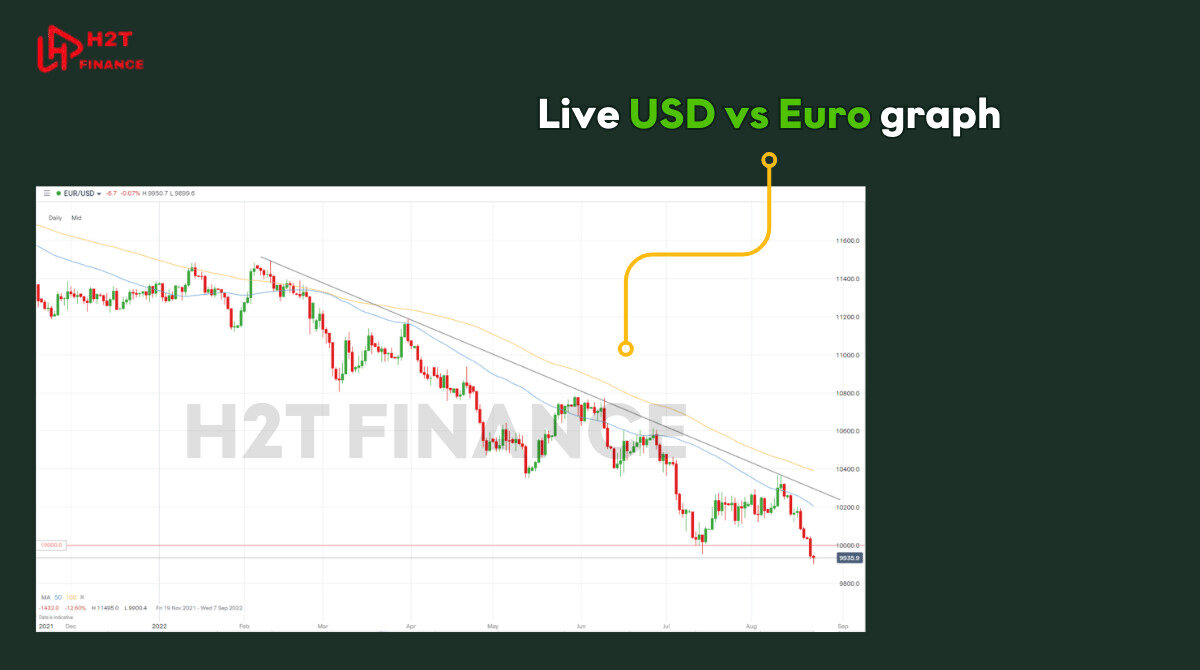
On platforms like TradingView, the usd vs eur graph can be customized to show candlesticks for time frames as short as 1 minute. You can layer indicators such as RSI or moving averages to spot trends or momentum in real time.
4.2. Historical USD vs Euro graph: long-term perspective
Historical charts provide a broader view of exchange rate trends over weeks, months, or even decades. These are ideal for:
- Analyzing long-term trends and cycles in currency behavior.
- Comparing macroeconomic periods, such as pre- and post-crisis.
- Educational purposes, helping beginners understand how external events influence the market over time.
Websites like XE.com and X-Rates offer historical data going back several years, making it easier to observe significant milestones such as the euro’s all-time high or the dollar’s strongest months.
4.3. Which one should you use?
| Purpose | Recommended Chart Type | Platform Example |
| Day trading, scalping | Live chart | TradingView |
| Learning and long-term outlook | Historical chart | XE.com, X-Rates |
| Event reaction (e.g., news) | Live chart | TradingView, Investing.com |
In summary, both live and historical USD vs Euro graph serve vital but different roles. Choosing the right one depends on your specific needs whether you're planning a trade today or researching how the euro and dollar have evolved over time.
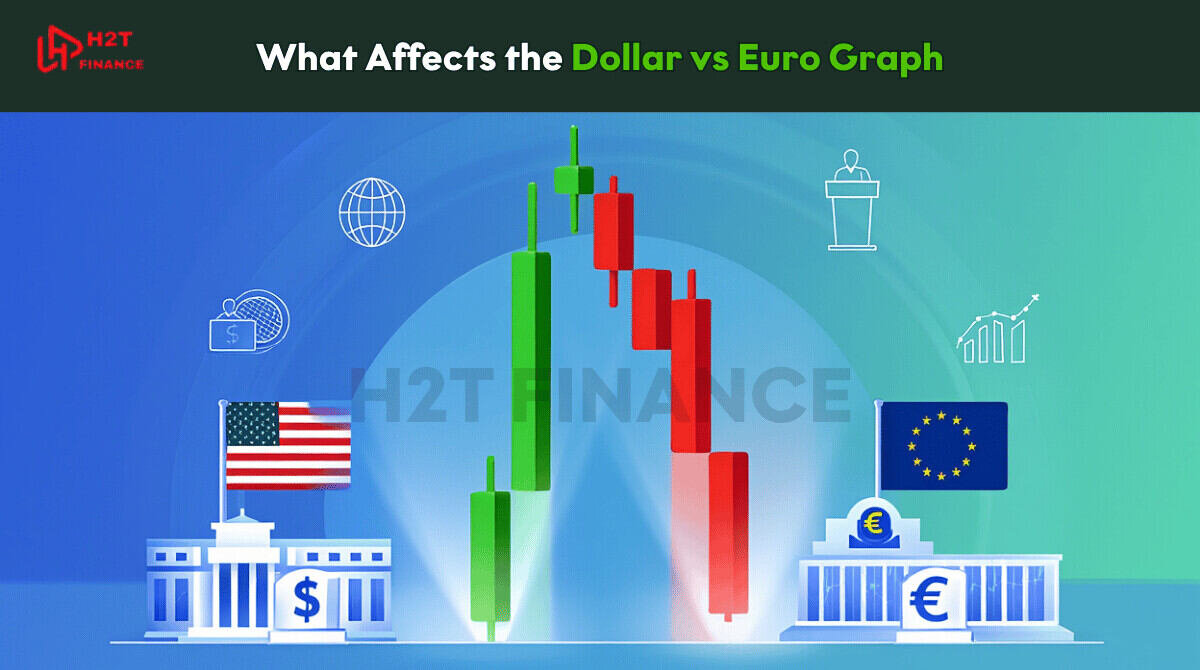
5. What affects the dollar versus euro graph?
The movements you see on the dollar versus euro graph are never random; they are the direct result of powerful economic, political, and financial forces at play.
By understanding what drives these changes from central bank announcements to global crises you can begin to connect real-world events to the price action on the chart and interpret trends with much greater confidence.
5.1. Interest rate policies: the Fed vs the ECB
One of the biggest influences on the EUR/USD exchange rate is interest rate policy, especially from:
- The Federal Reserve (Fed) in the United States
- The European Central Bank (ECB) for the eurozone
When the Fed raises interest rates, the U.S. dollar tends to strengthen, making the graph move in favor of the USD. Conversely, when the ECB increases rates, the euro may appreciate. Traders anticipate these changes, often reacting to forward guidance and policy statements.
5.2. Inflation and economic indicators
Economic health plays a major role in shaping the dollar versus euro graph. Some key metrics include:
- Inflation rates
- Unemployment figures
- GDP growth
- Consumer confidence
Stronger-than-expected data from either region often boosts that currency’s value. For instance, if the U.S. posts higher GDP growth than Europe, investors may shift capital into dollars, pushing the exchange rate higher.
5.3. Geopolitical events and global sentiment
The forex market reacts quickly to global events. The USD vs Euro graph is especially sensitive to:
- Political uncertainty (e.g., elections, wars, trade tensions)
- Natural disasters or pandemics
- Shifts in risk appetite (e.g., when investors seek safe-haven assets like USD)
For example, during periods of European debt crisis or U.S. government shutdowns, the usd vs eur graph may show strong swings in either direction depending on investor reaction.
5.4. Market speculation and capital flows
Currency movements are also influenced by investor behavior. Speculation, hedge fund positioning, and institutional flows can temporarily shift the EUR/USD exchange rate even in the absence of major news.
By understanding what affects the dollar versus euro graph, even beginners can start connecting headlines to price action and make sense of the constant ups and downs in the currency market.
6. Real examples of EUR/USD price movements
Theory is important, but seeing how it plays out in the real world is what truly builds understanding. Let's examine two key historical moments on the euro vs USD graph. These examples clearly demonstrate how major economic events and policy shifts can create significant price movements, offering valuable lessons for analyzing future market behavior.
Below are two key moments where the euro vs USD dollars graphs displayed significant shifts in direction, giving us insight into how sensitive currency markets are to global conditions.
6.1. Example 1: ECB rate cuts in 2019
In 2019, the European Central Bank (ECB) lowered interest rates further into negative territory to stimulate economic growth. This move led to a significant weakening of the euro. On most EUR/USD charts during this period, we can clearly observe:
- A declining trend in the USD vs Euro graph
- Increased volatility as markets reacted to monetary easing
- Short-term rallies followed by further downward pressure
The decision reflected concerns about sluggish growth and low inflation in the eurozone, making the euro less attractive compared to the dollar, which at the time was supported by relatively higher Fed rates.
6.2. Example 2: U.S. dollar surge during the 2022 inflation crisis
During the first half of 2022, the U.S. Federal Reserve raised interest rates aggressively in response to soaring inflation. This made the dollar significantly stronger against nearly every major currency, including the euro.
Key features on the euro vs USD graph during this period include:
- A sharp drop in the EUR/USD exchange rate
- The euro falling close to parity (1.00 USD) for the first time in two decades
- The graph showing a persistent downtrend reflecting confidence in the U.S. economy relative to Europe
This moment was pivotal and widely covered by financial news outlets, as it signaled a shift in global capital toward the U.S. and raised concerns about economic divergence between the regions.
Takeaway
Events like these demonstrate how monetary policy, inflation, and market sentiment can drastically reshape the euro vs USD dollars graphs.
Related reads to deepen your knowledge:
- Lead pip vs trailing pip: Key differences explained
- MT4 MT5 trading software forex ratings & strategy guide
- Flag and pennant patterns in trading: A complete guide
7. Related questions about the USD vs Euro graph (FAQs)
As you start exploring the USD vs euro graph, it's natural to have questions about how it all works. To help you along, we've answered some of the most common queries that beginners have regarding currency strength, price movements, and historical highs and lows.
7.1. Is the dollar going up or down against the euro?
The value of the U.S. dollar against the euro changes daily, driven by interest rates, inflation reports, and geopolitical factors. You can track whether the dollar is rising or falling using a live USD vs euro graph from platforms like TradingView or XE.com. In general:
- A rising graph means the dollar is strengthening.
- A falling graph means the euro is gaining value.
For the most accurate answer, always refer to real-time data.
7.2. What's stronger, the euro or the dollar today?
The strength of a currency is relative and depends on current market conditions. Today, if 1 USD = 0.90 EUR, the dollar is stronger; if 1 EUR = 1.10 USD, the euro holds more value. Use tools like X-Rates to see the latest figures on the euro vs USD graph and compare real-time performance.
7.3. Why is the euro falling?
The euro tends to fall when:
- The European Central Bank adopts dovish (low interest rate) policies.
- Economic data from the Eurozone is weaker than expected.
- Global investors seek safety in the U.S. dollar during times of uncertainty.
When these factors align, the dollar versus euro graph often shows a downtrend, with the euro losing ground against the dollar.
7.4. What is the highest euro to dollar in history?
The EUR/USD reached its all-time high near 1.60 in July 2008, during the U.S. financial crisis. At that time, market confidence in the euro was relatively high, and the dollar was weakening due to falling interest rates and economic instability.
You can view this peak on long-term historical charts, particularly on platforms that show multi-decade trends in the euro vs USD dollars graphs.
8. Conclusion: Learn to read and analyze the USD vs Euro graph effectively
In conclusion, the USD vs Euro graph is more than just numbers, it's a living narrative of the global economy. With the knowledge from this guide, you now have a solid foundation to confidently analyze one of the most important currency pairs.
At H2T Finance, we are committed to providing the deep insights and effective tools you need to master the market. Continue your journey by exploring more expert analysis in our Currency Pairs category. Start today by applying what you've learned to track and interpret the USD vs Euro graph, turning knowledge into your own unique advantage.