If you're trading Forex, you know that looking at a single currency pair only tells you part of the story. To get the full picture, many smart traders turn to the U.S. currency index chart. Think of it as your go-to tool for a quick, clear reading on the U.S. dollar's overall strength or weakness against other major currencies.
Unlike looking at individual pairs in isolation, this index provides a consolidated view that helps decode market sentiment and economic trends affecting the dollar globally.
Whether you’re a seasoned trader or exploring advanced strategies, mastering how to read and interpret the USD currency index chart can elevate your trading decisions and sharpen your edge in the market.
1. What is the USD currency index (DXY)?
To understand the role of the usd currency index chart in Forex analysis, it’s essential to first grasp what the USD Index also known as DXY actually is. The U.S. Dollar Index is a benchmark that measures the value of the U.S. dollar relative to a basket of foreign currencies. It serves as a crucial tool for evaluating the dollar's overall strength in global markets.
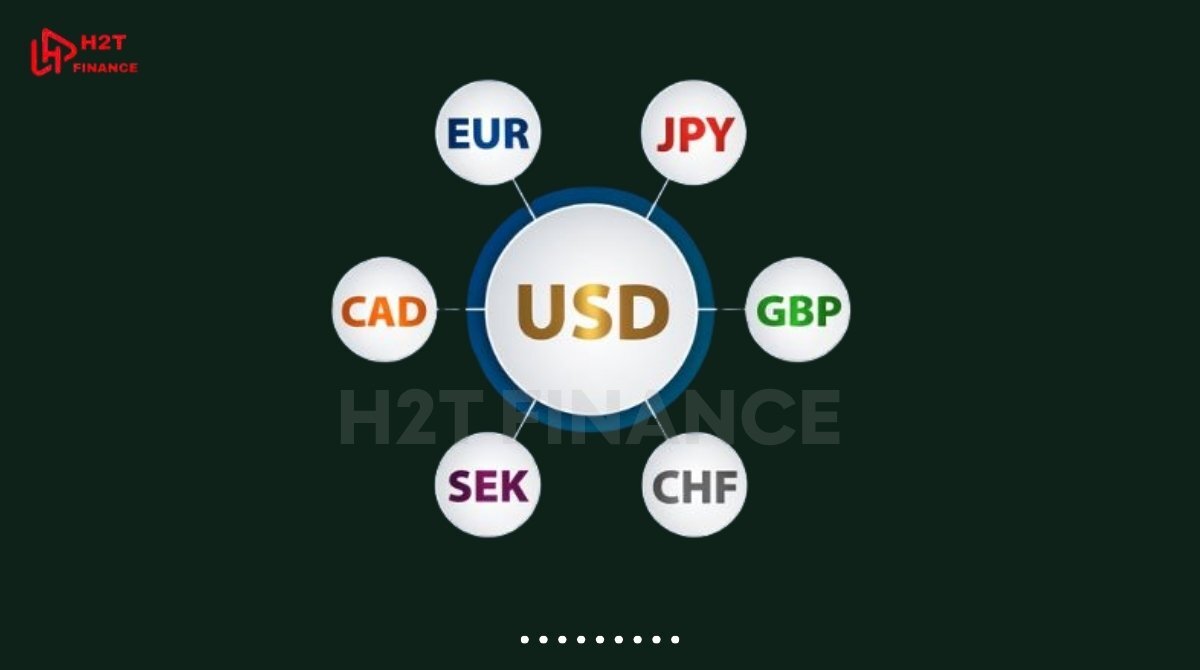
Created in 1973 by the U.S. Federal Reserve and later used by the Intercontinental Exchange (ICE) as a basis for futures contracts, the DXY tracks the dollar’s performance against six major world currencies: the euro (EUR), Japanese yen (JPY), British pound (GBP), Canadian dollar (CAD), Swedish krona (SEK), and Swiss franc (CHF). Among these, the euro carries the most weight, accounting for nearly 58% of the index.
The DXY is calculated using a trade-weighted geometric mean formula. It's important to note that these weights were set based on trade data from 1973 and have not been updated to reflect current global trade patterns. Despite this, the index remains a reliable indicator of USD demand, especially during periods of high economic or geopolitical volatility.
On charting platforms like TradingView, the DXY is often labeled with the symbol TVC:DXY, while its official futures contract symbol on the ICE exchange is 'DX'. These US dollar currency index chart are updated in real-time, allowing traders to analyze fluctuations in USD strength as they occur.
By monitoring the DXY, traders can better interpret movements in major forex pairs and anticipate shifts in market sentiment. It’s not a tradable asset by itself on spot forex platforms, but many brokers offer DXY-based CFDs or ETFs that mimic its behavior.
2. Why traders monitor the US currency index charts
Understanding us dollar currency index charts provides traders with valuable macro-level insight into the strength or weakness of the U.S. dollar.
Since the dollar is the world’s most traded currency and a reserve asset, its movements influence a wide range of forex pairs and global markets. Monitoring the DXY chart can help traders anticipate potential trends, avoid false signals, and refine their strategy in real time.
So, what makes the USD Index so crucial that it’s on the screen of almost every serious trader? The answer lies in how it directly impacts your trading decisions.
2.1. The index as a sentiment indicator for USD
The u.s. dollar currency index acts as a barometer for market sentiment toward the dollar. When the index is rising, it generally signals that investors are confident in the U.S. economy, or that there's a flight to safety in times of uncertainty.
Conversely, a declining DXY often reflects risk-on behavior, where traders shift to higher-yielding or emerging market currencies.
Because of its broad representation, the index offers a clearer picture of USD strength than looking at individual pairs in isolation.
2.2. Impact of DXY on major pairs like EUR/USD, GBP/USD, USD/JPY
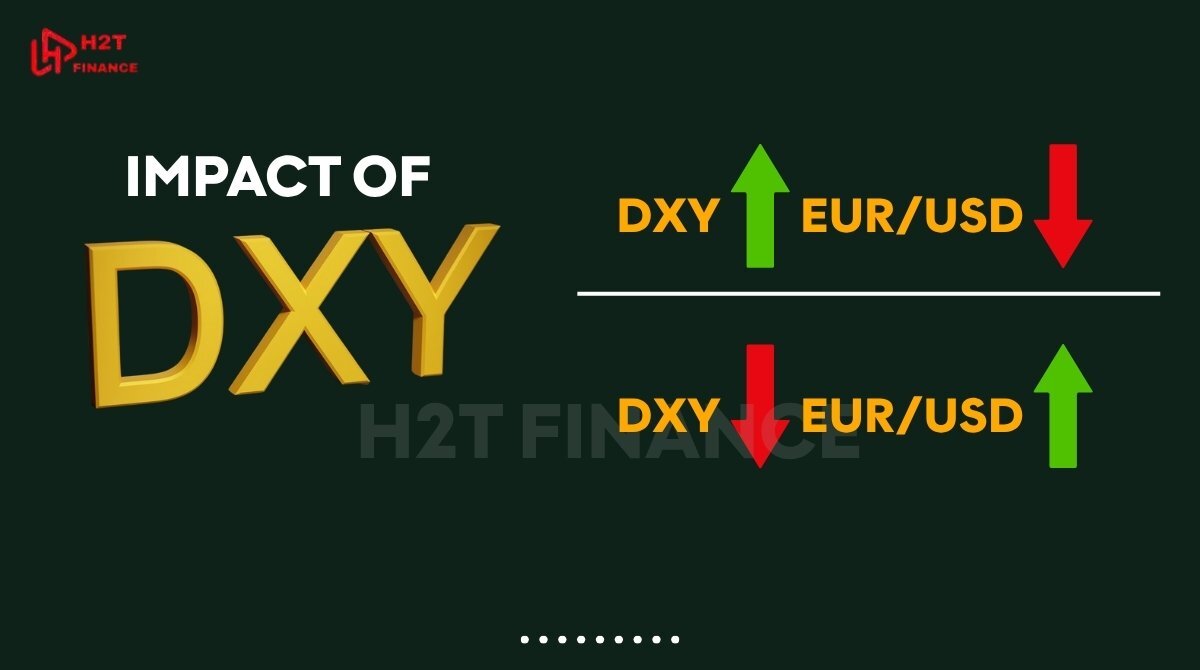
Since the euro holds the highest weighting in the DXY basket, movements in the DXY chart often have an inverse relationship with EUR/USD. For example:
- If the DXY rises, EUR/USD tends to fall.
- If the DXY drops, EUR/USD may climb.
Similarly, USD/JPY often mirrors DXY’s direction because the yen is part of the basket. GBP/USD and USD/CHF are also influenced by changes in DXY, though to a slightly lesser extent. This correlation helps traders use the usd currency index chart as a directional tool.
2.3. DXY’s correlation with commodities (gold, oil)
DXY doesn't just affect currency pairs it also correlates with commodities. Many commodities like gold and oil are priced in U.S. dollars. When the dollar strengthens:
- Gold and oil prices typically decline.
- A weaker dollar, on the other hand, supports higher commodity prices.
This makes DXY particularly useful for traders with positions in both forex and commodities, offering a broader economic perspective.
2.4. Example scenarios: how rising/falling DXY affects trades
Here are a few real-world examples of how traders might respond to DXY movements:
- Rising DXY: A breakout above resistance may signal USD strength, prompting traders to go long on USD/JPY or short EUR/USD.
- Falling DXY: A bearish divergence between DXY and price action may suggest an opportunity to buy gold or enter a long position in EUR/USD.
By integrating DXY insights with technical setups, traders can improve timing and decision-making across multiple asset classes.
3. How to read and analyze a USD currency index chart
Interpreting the usd currency index chart is essential for traders who want to incorporate macro-level analysis into their strategy. While the DXY may look similar to a standard forex price chart, it reflects the performance of the U.S. dollar against a weighted basket of currencies.
Knowing how to read it properly can offer early signals of broad USD trends critical for timing trades and avoiding misleading setups.
Let’s walk through the chart types, tools, and techniques most commonly used when analyzing us dollar currency index charts.
3.1. Chart types and what they show
Most charting platforms offer DXY in various formats:
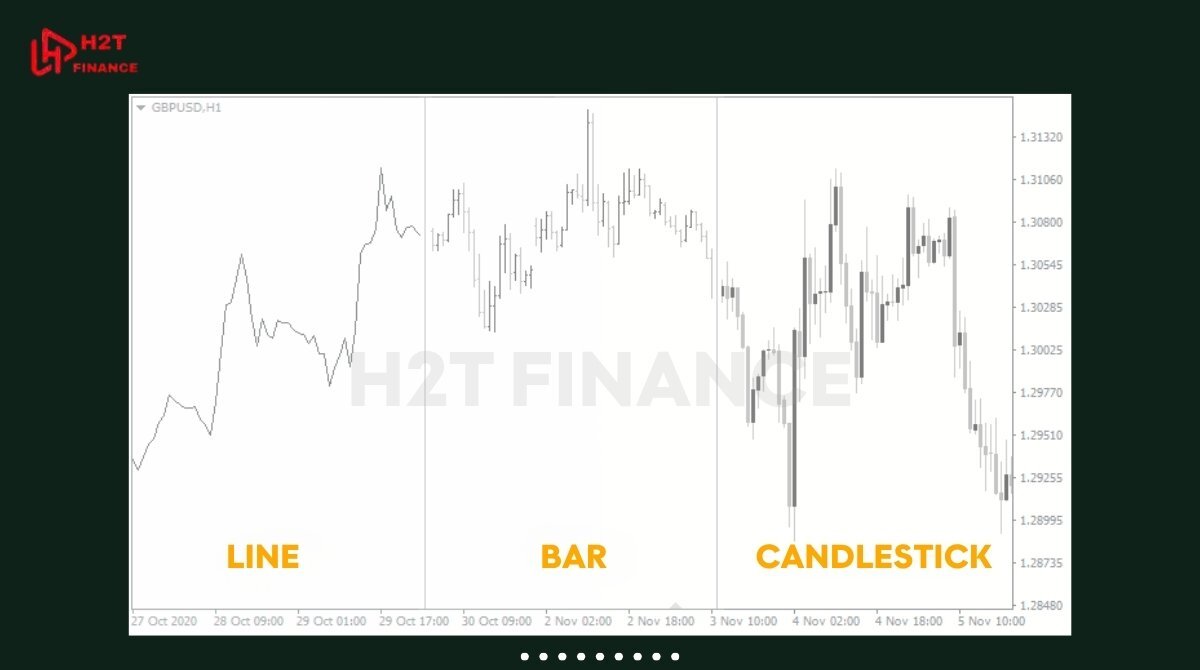
- Candlestick charts: Show opening, high, low, and closing prices for each period useful for spotting price action signals and key reversal patterns.
- Line charts: Good for visualizing overall trend direction over time.
- Bar charts: Similar to candlesticks but display data differently; often used for historical analysis.
Candlestick charts are the most common format among technical traders analyzing us currency index charts because they reveal price behavior and momentum shifts in real time.
3.2. Key components to focus on
Before applying indicators, it’s important to identify core elements of the chart:
- Support and resistance levels: Previous highs/lows where price tends to react. These zones help identify potential breakout or reversal points.
- Trendlines: Visual guides that connect swing highs or lows. An upward trendline can suggest sustained USD strength.
- Volume (if available): Volume spikes may confirm the strength of a breakout or trend.
3.3. Indicators commonly used with DXY
To enhance interpretation of the u.s. dollar currency index, traders often apply technical indicators. Here are a few effective ones:
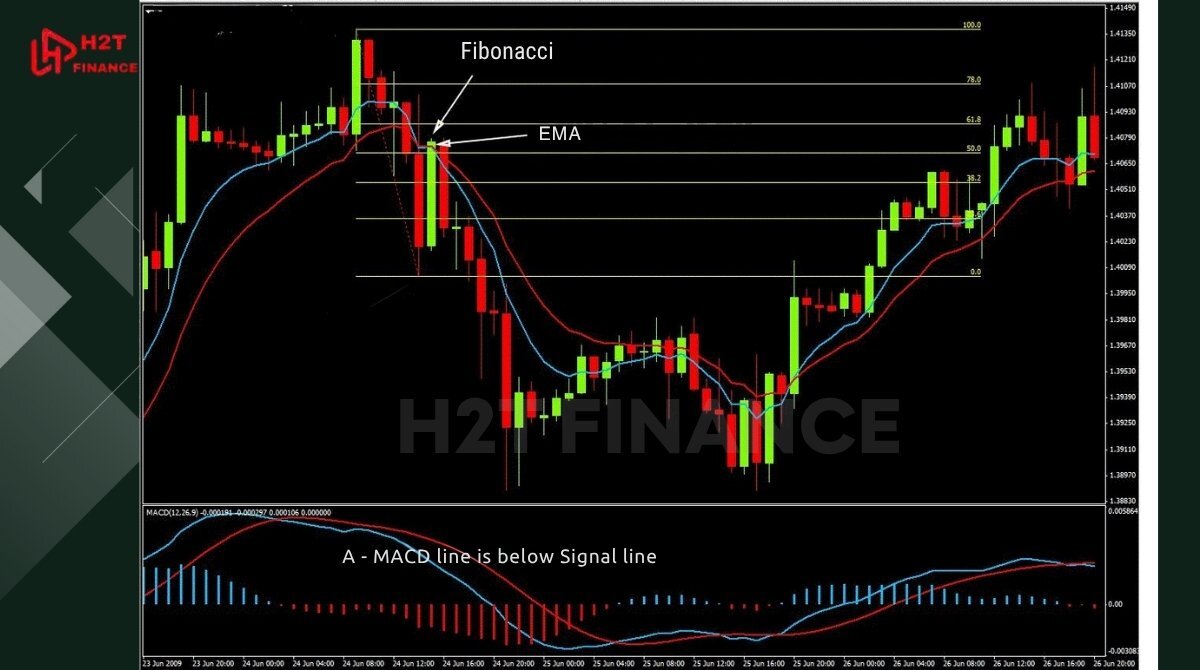
- Moving Averages (MA, EMA): Used to smooth out price action and define trend direction.
- Relative Strength Index (RSI): Helps identify overbought or oversold conditions.
- MACD (Moving Average Convergence Divergence): Reveals momentum and potential reversal zones.
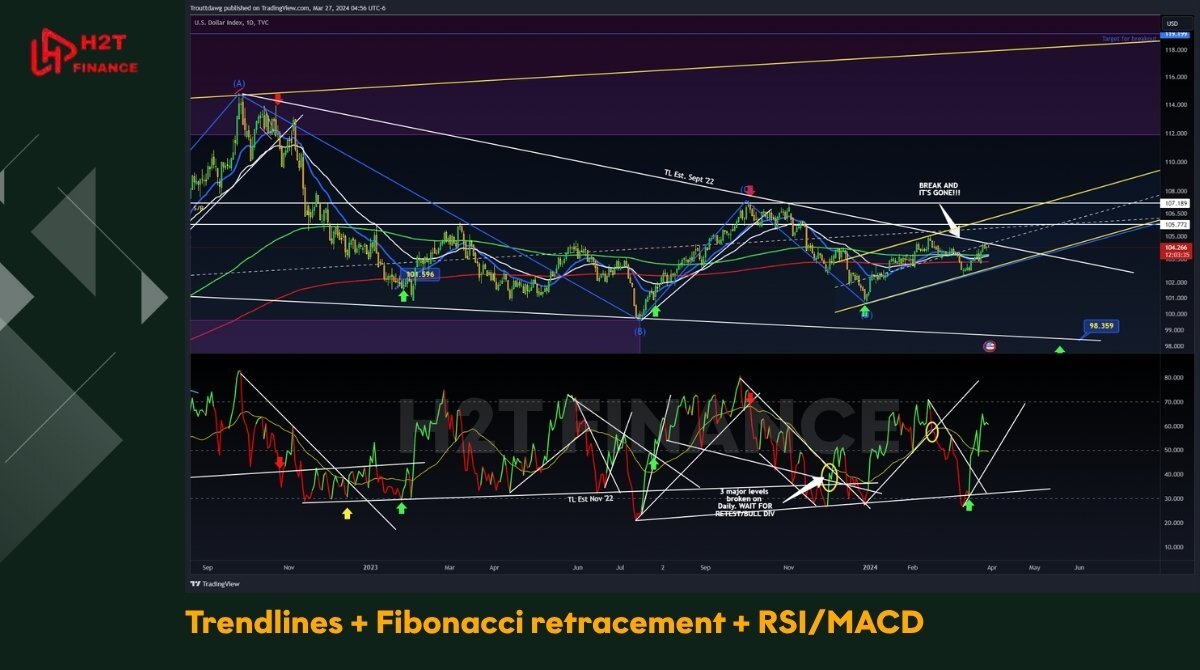
- Fibonacci Retracement: Useful for spotting potential pullback levels within broader trends.
Read more: How to Use Fibonacci Retracement: A Practical Guide for Traders
These tools, when applied correctly, can help you filter noise and focus on key decision zones.
3.4. Example: analyzing a DXY breakout
Imagine DXY is consolidating below a resistance level at 105.00. After several failed attempts, a strong bullish candlestick closes above this level on high volume. Simultaneously, RSI breaks above 50, and MACD shows a bullish crossover.
This confluence may signal further upside in the USD offering trade setups across USD pairs like USD/JPY or short opportunities in EUR/USD.
To fully take advantage of these moves, traders often monitor the usd currency index chart in multiple timeframes such as daily for overall trend, and hourly for entry points.
4. How the USD index supports forex strategy
The usd currency index chart is more than just a visual representation of dollar strength it’s a strategic tool for forex traders. Whether you're trading USD-based pairs or cross-currency setups, the DXY can offer crucial insights into market direction, momentum, and potential reversals.
This section explores how traders incorporate the US dollar currency index into their strategies and decision-making processes.
4.1. Using DXY to confirm trend strength in USD pairs
Many traders use the DXY as a confirmation indicator when trading major pairs like EUR/USD, USD/JPY, or GBP/USD. Here’s how:
- If you're planning to go long on USD/JPY, a rising DXY can support that bias.
- Conversely, if you're watching for a short opportunity on EUR/USD, a bullish DXY trend adds confidence to your position.
I’ve personally found this to be a game-changer. It acts as a final gut check before I enter a trade. For instance, if a USD pair looks like it’s breaking out, a quick look at the DXY tells me if the move is backed by broad market strength or if it's just a fluke specific to that one pair.
4.2. Combining DXY with technical or fundamental analysis
The us currency index chart can be paired with other technical and fundamental tools to create a more complete trading setup.
- Technical combo: Use DXY in conjunction with trendlines, Fibonacci retracements, or momentum indicators like RSI to spot confluence zones.
- Fundamental combo: Monitor the DXY around key events such as FOMC meetings, U.S. CPI releases, or interest rate decisions. For example, a hawkish Fed announcement followed by a spike in DXY can confirm a USD-buying opportunity.
This combination of approaches can improve entry timing and reduce the likelihood of false signals.
4.3. Examples
Let’s say you spot a potential head-and-shoulders reversal on EUR/USD, suggesting a bearish move. Before entering the trade, you check the usd currency index chart and notice DXY is bouncing off a strong support zone with bullish divergence on RSI. This added confirmation could strengthen your conviction and improve your risk-reward setup.
Another example: DXY breaks above a multi-week consolidation range. In response, traders might scan for breakout setups on USD/CAD or USD/CHF, expecting the broader USD strength to spill over into other pairs.
4.4. Tips to avoid false signals
While the DXY is powerful, it shouldn’t be used in isolation. Here are a few tips to improve its effectiveness:
- Always pair DXY analysis with price action on individual pairs.
- Avoid making decisions based on small DXY moves during low-volume sessions.
- Use multiple timeframes to confirm trend alignment.
- Watch for divergence between DXY and USD pairs as potential warning signs.
Ultimately, the u.s. dollar currency index is best used as a supporting tool guiding your strategy, not dictating it.
5. USD currency index vs. individual USD pairs: what’s the difference?
At first glance, the usd currency index chart and USD forex pairs like EUR/USD or USD/JPY might appear to tell the same story. However, there are critical differences between tracking the USD through an aggregated index like DXY and analyzing its behavior in one-on-one currency pairings. Understanding these distinctions can help traders apply the right tool for the right context.
Let’s explore how the DXY compares to individual USD-based currency pairs and when you should use one over the other.
5.1. DXY as a composite view
The us dollar currency index represents a broad, weighted average of the USD’s performance against a basket of six major currencies, with the euro making up nearly 58% of the total weighting. This composite structure smooths out individual volatility and offers a big-picture view of overall dollar strength or weakness.
In contrast, each USD currency pair is influenced by its counterpart's strength, independent of the broader USD trend. For example, even if DXY is rising, USD/JPY may not rally if the Japanese yen is strengthening due to local factors.
Thus, DXY gives you a macro sentiment overview, while individual pairs provide specific trade opportunities.
5.2. Differences between trading DXY and USD-based forex pairs
|
Factor |
USD Currency Index (DXY) |
USD-based Forex Pairs (e.g., EUR/USD) |
|
Composition |
Weighted basket (6 currencies) |
One-on-one currency relationship |
|
Tradable via spot forex |
No (only via CFDs, futures, ETFs) |
Yes |
|
Volatility |
Smoother, more stable |
Higher volatility, more pair-specific |
|
Best for |
Trend confirmation, USD sentiment |
Precise entry/exit trading |
|
Influencing factors |
U.S. macroeconomics, global trends |
Both U.S. and counter-currency factors |
The us dollar currency index chart is not directly tradable in the spot forex market, but traders can access it through derivatives like DXY futures, ETFs (e.g., UUP), or CFDs offered by some brokers. In contrast, major USD pairs are widely available for trading on virtually all forex platforms.
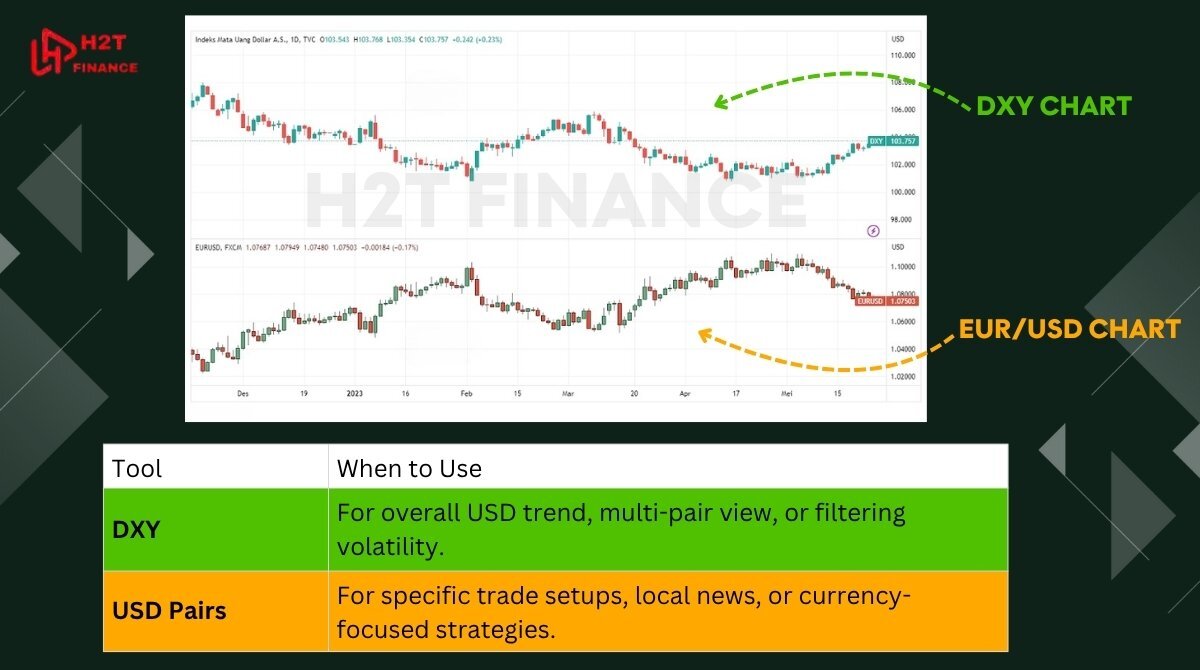
5.3. When to use DXY vs. when to analyze direct pair price action
-
Use DXY when:
-
You want to confirm overall USD momentum before entering trades.
-
You're analyzing multiple USD pairs and need a broader market view.
-
You're trying to filter false signals caused by counter-currency volatility.
-
-
Use individual USD pairs when:
-
You’re entering a specific trade setup with defined levels and timing.
-
You want to take advantage of local news or events (e.g., ECB policy impacting EUR/USD).
-
You're building a strategy around a specific currency's behavior.
-
In many cases, the best approach is to use both. For example, confirm USD strength via the usd currency index chart, then zoom into a USD pair that aligns with the broader trend for a more accurate trade.
6. Limitations and misinterpretations of the DXY chart
While the usd currency index chart is a powerful tool for gauging the U.S. dollar's overall strength, it has inherent limitations and common pitfalls that traders should be aware of. Understanding these constraints helps avoid misinterpretations and supports better-informed trading decisions.
Below are key points to consider when using the US dollar currency index in your analysis.
6.1. It does not represent all USD pairs (e.g., AUD, NZD excluded)
The DXY tracks the USD against only six major currencies: EUR, JPY, GBP, CAD, SEK, and CHF. Notably, popular pairs like AUD/USD and NZD/USD are excluded from the index calculation. This means that price moves in those pairs may not be reflected in the DXY, which can lead to discrepancies when using the index as a market barometer.
For example, if the Australian dollar strengthens sharply due to domestic factors, AUD/USD may decline even if the DXY is rising.
6.2. Overweight on EUR (approx. 57.6%)
Because the euro constitutes nearly 58% of the u.s. dollar currency index basket, the DXY's movements are heavily influenced by EUR/USD price action. This concentration can skew interpretations: a move in the eurozone or ECB policy can disproportionately impact the index, even if other currencies in the basket remain stable.
Traders need to be cautious not to over-attribute DXY changes purely to USD strength without considering euro-specific events.
6.3. Can give skewed signals during geopolitical shocks
During periods of geopolitical tension or major economic shocks, currency behaviors can become unpredictable. The DXY may give misleading signals because it aggregates diverse currencies with varying reactions to events.
For example, a flight to safety might strengthen the yen and the dollar simultaneously, causing mixed signals on the index. Traders should supplement DXY analysis with current news and volatility assessments.
6.4. Use as a complementary tool, not a sole indicator
Perhaps most importantly, the usd currency index chart should never be used in isolation. While it offers valuable macro insights, relying solely on DXY can lead to missed nuances in individual pairs or overconfidence in broad trends.
Integrating the DXY with price action analysis, technical indicators, and fundamental news will provide a more robust, balanced trading approach.
Related reads to deepen your knowledge:
- Elegant oscillator indicator formula: How it works & how to use
- How to trade the Forex market: Strategies & tools explained
- When is the best time to trade forex? Full beginner guide
7. Related questions about usd currency index charts (FAQs)
Traders new to the usd currency index chart or those looking to deepen their understanding often have common questions. Here are clear answers to some of the most frequently asked queries about the DXY and its role in forex trading.
7.1. What is the best time frame to use with DXY?
The optimal timeframe depends on your trading style:
-
Long-term investors tend to focus on daily or weekly charts to capture major trends in the USD.
-
Swing traders may prefer 4-hour or daily charts for intermediate signals.
-
Day traders might use hourly or 15-minute charts to time short-term entries and exits.
Using multiple timeframes can also help confirm trend alignment and reduce false signals.
7.2. Can I trade the DXY directly?
The usd currency index itself is not available as a spot forex pair. However, traders can gain exposure through:
-
DXY futures contracts on exchanges like ICE.
-
Exchange-Traded Funds (ETFs) such as the Invesco DB US Dollar Index Bullish Fund (UUP).
-
Contracts for Difference (CFDs) offered by some brokers.
These instruments allow traders to speculate on USD strength based on the DXY without trading the underlying currencies individually.
7.3. Why is EUR/USD so important in the DXY chart?
Since the euro accounts for nearly 58% of the us dollar currency index, fluctuations in EUR/USD heavily influence the index’s movement. As a result, EUR/USD often moves inversely to the DXY:
-
When EUR/USD rises, DXY tends to fall.
-
When EUR/USD falls, DXY usually rises.
This relationship makes EUR/USD a key pair to watch alongside the usd currency index chart.
7.4. How often is the U.S. dollar index updated?
The DXY's value is calculated and updated continuously throughout the trading week (nearly 24/5) based on the movements of its component currency pairs in the spot forex market. Most charting platforms provide live data feeds, reflecting the latest market movements. However, it is important to note that the official DXY futures contract on the ICE exchange has its own specific trading hours.
7.5. Is the USD index affected by Federal Reserve news?
Absolutely. The DXY is highly sensitive to monetary policy decisions from the Federal Reserve (Fed). Interest rate changes, quantitative easing announcements, and economic outlooks from the Fed can cause significant moves in the usd currency index chart.
Traders closely monitor Fed meetings and statements to anticipate potential shifts in USD strength.
8. Conclusion: should you use the USD currency index chart in your strategy?
So, should the usd currency index chart be part of your trading toolkit? Absolutely. The bottom line is this: trading a USD pair without glancing at the DXY is like sailing without a compass.
It’s not a standalone indicator, but when you combine it with your price action analysis, technical indicators, and fundamental news, it gives you direction and helps you avoid sailing straight into a storm. Use it wisely to confirm your analysis, and it will undoubtedly sharpen your edge in the market.
To deepen your knowledge and explore more about forex trading, consider browsing our Currency Pairs category on H2T Finance, where you’ll find detailed guides and analysis that complement your use of the usd currency index chart.