Have you ever wished you could call the market's bluff right at the moment it's about to reverse? Catching a trend right at its turning point isn't just about maximizing profits; it's about minimizing those painful drawdowns.
For many traders, accurately identifying these elusive market turns feels like discovering the ultimate competitive edge. Many believe that uncovering the "trading secrest to find tops and bottoms" promises significant rewards, yet demands precision and strategic depth.
How can one truly discern a genuine trend exhaustion from a mere fleeting pullback? This article is your practical guide. We'll delve into actionable strategies and powerful analytical tools, empowering you to confidently identify high-probability turning points and refine your reversal trading approach. Designed for traders seeking to elevate their analytical prowess, this guide will illuminate the path to mastering these crucial market shifts.
Key takeaways:
- Market tops and bottoms represent critical turning points where trends exhaust and new directions begin.
- Trader psychology (fear and greed) plays a major role in driving reversals.
- Candlestick and chart patterns like Head and Shoulders or Double Tops/Bottoms are essential for spotting trend shifts.
- Technical indicators (RSI, MACD, Bollinger Bands, Fibonacci) help confirm potential reversals when combined with price action.
- Confluence of multiple signals and multi-timeframe analysis increase the probability of successful reversal trades.
- Risk management through stop losses and proper position sizing is vital to protect capital.
- Common mistakes include overtrading, relying on a single indicator, and ignoring higher timeframe context.
- Success in reversal trading requires patience, discipline, journaling, backtesting, and continuous learning.
1. Understanding market tops and bottoms: The foundation of reversal trading
To truly master reversal trading, we must first grasp the fundamental concepts of what constitutes a market top or bottom. These are not merely random points on a chart but critical junctures where the prevailing trend exhausts itself, paving the way for a new direction.
1.1. What are market tops and bottoms in Forex?
In Forex trading, market tops and bottoms refer to the highest and lowest points reached by price before it changes direction. These are often described as swing high and swing low points on a price chart.
- Market Top (Swing High): This occurs when the price reaches a peak and subsequently begins to decline. It represents a point where selling pressure overcomes buying pressure, signaling a potential bearish price reversal.
- Market Bottom (Swing Low): Conversely, a market bottom is formed when the price hits a trough and then starts to rise. Here, buying pressure overtakes selling pressure, indicating a potential bullish price reversal.
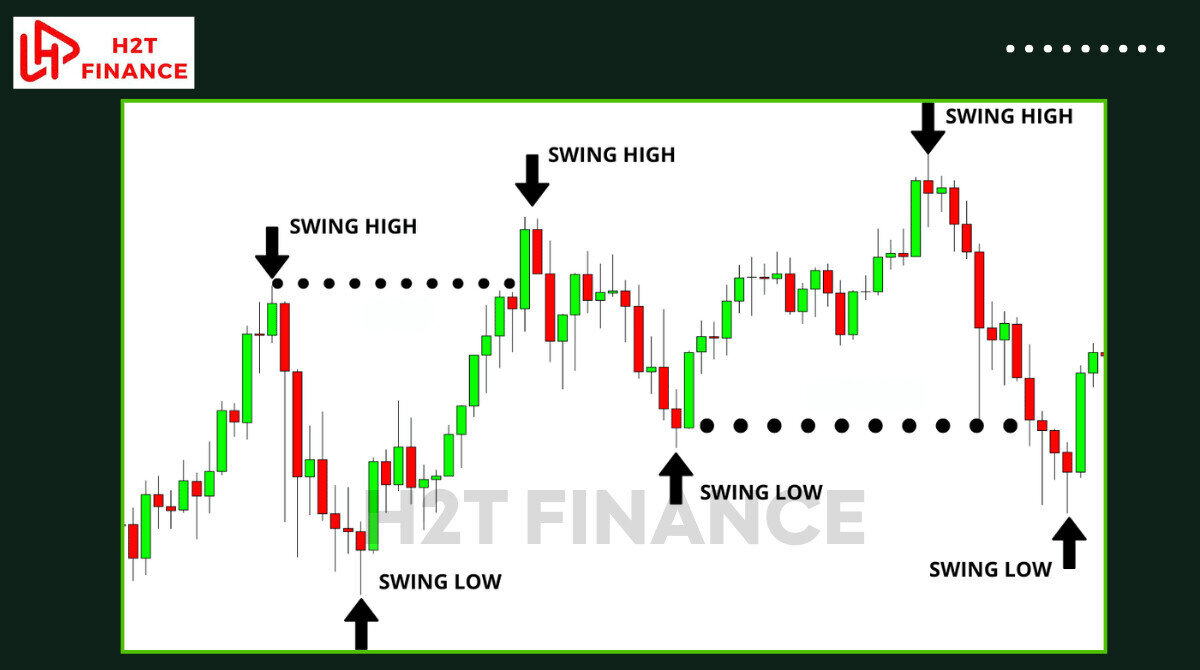
It's also crucial to differentiate between local (minor) and significant (major) tops and bottoms. Minor tops and bottoms are small fluctuations within a larger trend, while major ones mark the end of a long-term trend, indicating trend exhaustion and the start of a new, substantial move. Understanding this distinction helps in filtering out noise and focusing on the most impactful market turning points.
1.2. Why finding tops and bottoms is crucial for traders (and why it's challenging)
Identifying these pivotal market turning points offers immense advantages, making it a critical skill for any serious trader.
- Optimized Entry and Exit Points: Successfully spotting a bottom allows for an early entry into a new uptrend, maximizing potential profits. Similarly, identifying a top enables you to exit long positions or enter short positions near the peak, reducing losses and capitalizing on bearish moves. This directly impacts your risk-reward ratio, allowing for more favorable trade setups.
- Capitalizing on Reversals: While many strategies focus on trend continuation, mastering reversals lets you profit from shifts in momentum, often leading to rapid price movements. This means you're not just riding a trend, but potentially initiating the ride.
However, the pursuit of early entry into these price reversal zones is fraught with challenges:
- "Catching a Falling Knife" or "Picking a Top": Entering too early can lead to significant losses if the market continues its original direction before the actual reversal occurs. This often results in a false breakout or a premature entry against a strong existing trend.
- Emotional Biases: The fear of missing out (FOMO) can push traders to enter trades without sufficient confirmation, while the desire to be "right" can lead to holding losing positions for too long.
- Complexity of Market Dynamics: Markets are influenced by countless factors, and distinguishing genuine reversals from temporary pullbacks requires deep analysis and experience.
1.3. The psychology behind market reversals: What drives price turns?
Understanding trader psychology is just as vital as technical analysis when it comes to identifying key support and resistance levels and predicting market turning points. Ultimately, price movements are a reflection of collective human emotions – primarily fear and greed.
- Greed at the Top: As prices surge towards a market top, greed often dominates. Traders, fearing they'll miss out on further gains, continue to buy, pushing prices higher. However, at some point, the pool of eager buyers diminishes, and those who bought earlier start to take profits. This shift in supply and demand dynamics is what triggers the reversal.
- Fear at the Bottom: Conversely, at a market bottom, fear often reaches its peak. Traders, worried about further losses, panic sell, driving prices lower. Yet, this intense selling pressure eventually exhausts itself, and value investors or institutions step in, seeing an opportunity. This influx of buying interest then shifts the supply and demand balance, leading to an upturn.
Furthermore, the role of key support and resistance levels cannot be overstated. These are price zones where buying or selling pressure has historically been strong enough to reverse or pause price movements.
When price approaches these levels, combined with significant news events or shifts in market sentiment, the likelihood of a price reversal increases dramatically. Recognizing these psychological and structural elements forms the bedrock of successfully identifying potential market turning points.
2. Technical analysis tools: Unveiling the trading secrest to find tops and bottoms
Once you understand the underlying dynamics of market turning points, the next step is to equip yourself with the right technical analysis tools. These tools act as your eyes and ears in the market, helping you spot the subtle and obvious clues that signal a potential price reversal.
2.1. Mastering candlestick patterns for reversal signals
Candlestick patterns are fundamental to understanding price action and are often the earliest visual cues of a potential reversal pattern. These patterns tell a story about buyer and seller psychology within a specific timeframe.
One of the first lessons I truly learned in trading was to never ignore the story Japanese candlesticks tell at critical price zones. They aren't just simple confirmation signals; they are the market's psychological footprint, showing how the battle between buyers and sellers is playing out.
Here are some powerful reversal patterns that every trader should master:
- Bullish Reversal Patterns: These appear at the end of a downtrend, signaling that buyers are gaining control.
- Hammer: A small body at the top of the candle with a long lower wick, indicating rejection of lower prices.
- Inverted Hammer: A small body at the bottom of the candle with a long upper wick, showing buying pressure trying to push prices up.
- Morning Star: A three-candle pattern starting with a long bearish candle, followed by a small-bodied candle (often a Doji) that gaps down, and concluding with a long bullish candle that gaps up, suggesting a strong shift from sellers to buyers.
- Piercing Pattern: A bearish candle followed by a bullish candle that opens lower but closes more than halfway up the body of the first bearish candle.
- Bullish Engulfing: A small bearish candle completely engulfed by a large bullish candle, indicating a strong reversal of momentum.
- Bearish Reversal Patterns: These form at the end of an uptrend, suggesting that sellers are taking over.
- Hanging Man: Similar to a Hammer, but appears at the top of an uptrend, signaling selling pressure.
- Shooting Star: Similar to an Inverted Hammer, but at the top of an uptrend, indicating rejection of higher prices.
- Evening Star: The bearish counterpart to the Morning Star, a three-candle pattern signaling a shift from buyers to sellers.
- Dark Cloud Cover: A bullish candle followed by a bearish candle that opens higher but closes more than halfway down the body of the first bullish candle.
- Bearish Engulfing: A small bullish candle completely engulfed by a large bearish candle, indicating a strong reversal of momentum.
Remember, the effectiveness of these patterns is greatly enhanced when they appear at significant support or resistance levels and are accompanied by confirming volume changes.
2.2. Leveraging chart patterns for top and bottom identification
Beyond individual candlesticks, larger chart formations provide broader insights into market structure and potential reversals. These patterns represent periods of indecision or distribution/accumulation that often precede a major shift in trend.
For me, these chart patterns are like large-scale maps. They not only help anticipate market turns but also provide clear suggestions for potential price targets.
Here are some classic reversal chart patterns that are instrumental in identifying tops and bottoms:
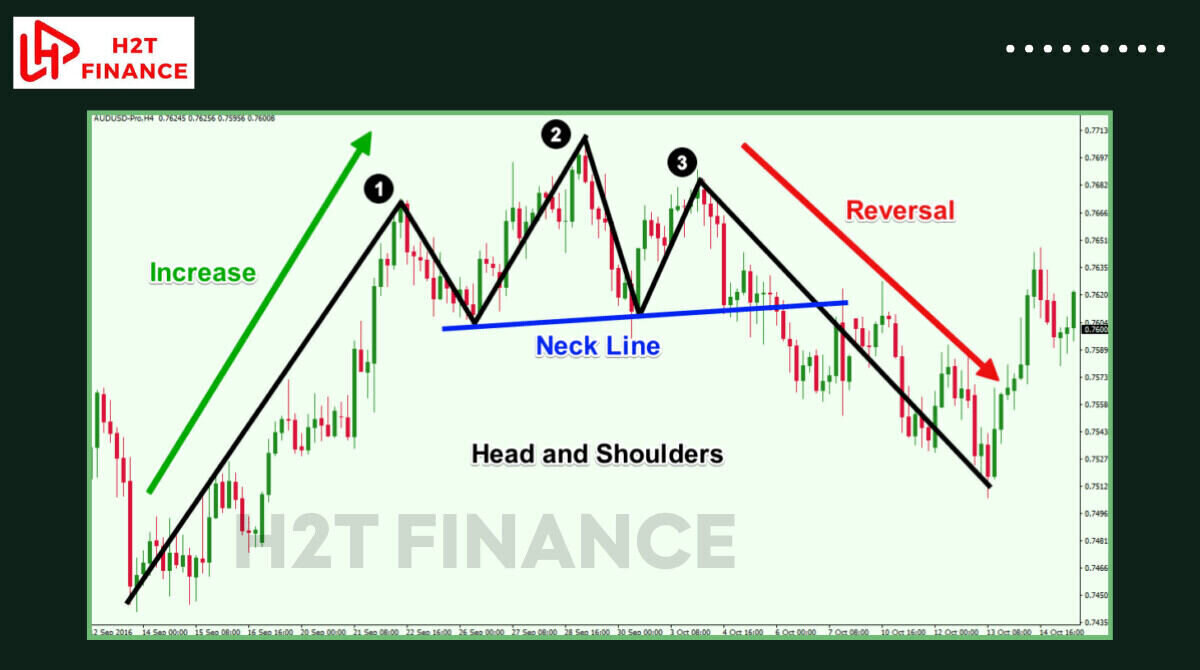
- Head and Shoulders (Top/Bottom):
- Head and Shoulders Top: A very common bearish reversal pattern, characterized by three peaks with the middle peak (the "head") being the highest, flanked by two lower peaks (the "shoulders"). A break below the "neckline" (drawn connecting the lows of the two valleys) confirms the reversal.
- Inverse Head and Shoulders Bottom: The bullish counterpart, featuring three troughs with the middle trough (the "head") being the lowest. A break above the neckline confirms a bullish reversal.
- Double Top/Bottom:
- Double Top: A bearish reversal pattern formed by two consecutive peaks at roughly the same price level, with a trough in between. A break below the trough's support level confirms the pattern.
- Double Bottom: A bullish reversal pattern formed by two consecutive troughs at roughly the same price level, with a peak in between. A break above the peak's resistance level confirms the pattern.
- Triple Top/Bottom: Similar to double tops/bottoms but with three peaks or troughs, often indicating even stronger resistance or support levels and a more significant reversal when confirmed.
- Rising/Falling Wedges:
- Rising Wedge: A bearish reversal pattern where price makes higher highs and higher lows, but the trend lines converge. A breakdown below the lower trend line indicates a reversal.
- Falling Wedge: A bullish reversal pattern where price makes lower highs and lower lows, but the trend lines converge. A breakout above the upper trend line indicates a reversal.
Drawing these chart formations accurately and understanding their implications for future price movements is a critical skill for pinpointing market turning points. They provide clear targets once the reversal is confirmed.
2.3. Top technical indicators for confirming reversals (and how I use them)
While price action and chart patterns are crucial, technical indicators provide additional layers of confirmation and can often highlight potential reversal signals that might not be immediately obvious. I always recommend using indicators as supplementary tools, not as standalone signals.
For me, indicators are not crystal balls. They are valuable assistants that help confirm what I already suspect from price action. Relying on them blindly is a mistake many newcomers make; using them to complement the market context is the key.
Here are some of the most effective technical indicators for confirming reversals, and how I personally leverage them:
- Oscillators (RSI, Stochastic): These momentum indicators are excellent for identifying overbought/oversold conditions and, more importantly, divergence.
- RSI (Relative Strength Index): I use the RSI to spot when price is entering overbought (above 70) or oversold (below 30) zones, which can precede a reversal.
But the most powerful signal for me is divergence. It's when price and the indicator are "out of sync." For example, when the price makes a lower low but the RSI indicator forms a higher low, it’s like a warning sign that says "the sellers' momentum is running out of steam," even if the downtrend looks intact on the surface. It's one of the most reliable early reversal signals.
A bearish RSI divergence shows price making a higher high, but RSI makes a lower high, indicating weakening bullish momentum.
- Stochastic Oscillator: Similar to RSI, the Stochastic helps identify overbought/oversold levels and momentum shifts. I often look for the K and D lines to cross in extreme zones, especially in conjunction with price action.
- MACD (Moving Average Convergence Divergence): The MACD is a versatile momentum indicator that helps identify trend changes.
- I primarily look for MACD divergence (similar to RSI divergence) as a strong early warning sign of a reversal.
- Additionally, the crossing of the MACD line over/under the signal line indicates a shift in momentum. My experience has shown that the MACD histogram turning color is an early signal for momentum changes, providing a visual cue for potential entries or exits.
- Bollinger Bands: These volatility bands can help identify potential tops and bottoms when price moves to the outer bands.
- When price pushes repeatedly against an outer band, especially after a period of Bollinger Bands squeeze (low volatility), it can indicate an impending expansion of volatility and a potential reversal.
- A strong price move outside the bands often leads to a quick snap back into the bands, representing a potential reversal point.
- Fibonacci Retracement/Extension: Fibonacci levels are not indicators in the traditional sense but are powerful tools for identifying dynamic key support and resistance levels where price might reverse.
- I apply Fibonacci Retracement from a swing high to a swing low (or vice-versa) to identify potential retracement levels (e.g., 38.2%, 50%, 61.8%) where the price might reverse before continuing the original trend, or where a deep retracement could signal a full reversal.
- Fibonacci Extension levels can help project potential price targets after a reversal has begun.
Using these indicators effectively involves understanding their strengths and weaknesses and, crucially, learning to combine them with price action and chart patterns for confirmation. Never rely on a single indicator in isolation.
3. Advanced strategies: Combining signals for high-probability reversals
While individual tools like candlestick patterns or indicators offer valuable insights, the true power in identifying market turning points lies in their synergy.
Advanced traders understand that confirming a reversal isn't about one perfect signal, but rather a confluence of multiple clues aligning. This approach significantly increases the probability of a successful trade setup.
3.1. The confluence strategy: Layering signals for stronger confirmation
The confluence strategy is about layering various analytical tools and signals to build a robust case for a potential price reversal. Instead of relying on a single indicator or pattern, you're looking for multiple reasons to believe a turning point is imminent. This multidisciplinary approach filters out noise and highlights high-probability setups.
For example, imagine you observe a bearish engulfing candlestick pattern forming at a significant resistance level. On its own, this is a decent signal. However, if simultaneously:
- The RSI shows bearish divergence (price making higher highs, but RSI making lower highs).
- The MACD histogram turns red, signaling a shift in momentum.
- The price action occurs at a key Fibonacci extension level.
My rule is simple: if I don't have at least three valid reasons, I won't enter a reversal trade. For instance, if the EUR/USD pair forms a Bearish Engulfing candle right at a resistance level on the H4 chart, while the RSI shows bearish divergence and the MACD histogram has just turned negative that's when I seriously consider a short entry. Each element is a piece of the puzzle, and I only act when the picture is clear enough.
3.2. Volume analysis: Unmasking true reversal power
Volume is often overlooked by newer traders, yet it holds crucial trading secrets about the conviction behind price movements. Analyzing volume analysis at potential market turning points can validate or invalidate a reversal signal, revealing the true "smart money" participation.
- High Volume at Tops/Bottoms with Strong Reversal Candles: A strong reversal pattern (like an Engulfing candle or Hammer) accompanied by significantly high trading volume suggests strong institutional involvement and conviction behind the reversal. This means a lot of money is changing hands at that level, indicating a strong rejection of previous prices. This can signal the trend exhaustion of the prior move.
- Decreasing Volume as Trend Approaches Tops/Bottoms: If a trend is making new highs or lows but on decreasing volume, it can be an early sign of trend exhaustion.
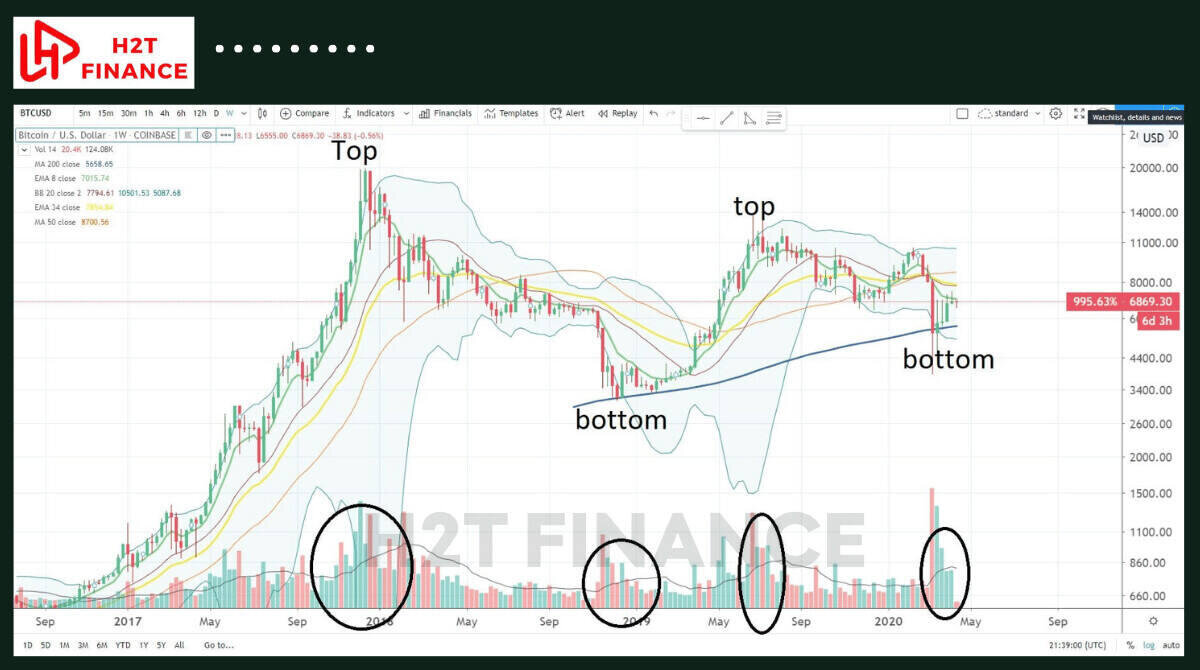
This divergence between price and volume indicates that the momentum is weakening, and fewer participants are willing to push the price further in the current direction. This often precedes a price reversal.
Understanding volume spikes and decreasing volume patterns can give you a significant edge, helping to differentiate genuine reversals from temporary pullbacks.
3.3. Multi-timeframe analysis: Seeing the bigger picture for confident entries
One of the most effective trading secrets for identifying robust tops and bottoms is multi-timeframe analysis. This technique involves looking at the same currency pair across different timeframes to gain a comprehensive understanding of the market's structure and potential market turning points.
- Identifying the Major Trend and Key Levels (Higher Timeframes): I typically start by analyzing higher timeframes like the Daily or H4 charts. These timeframes reveal the long-term trend and identify significant key support and resistance levels.
A reversal signal on a smaller timeframe gains much more credibility if it occurs at a strong support or resistance level identified on a higher timeframe. This provides a holistic view of the market.
- Pinpointing Precise Entries (Lower Timeframes): Once the major trend and critical zones are identified on the higher timeframes, I then zoom into lower timeframes (e.g., H1 or M30) to pinpoint precise entry points.
For instance, if the Daily chart shows price approaching a strong resistance level, I'll then look for reversal candlestick patterns or bearish divergence on the H1 chart to confirm a potential short entry. This layered approach ensures your short-term entry aligns with the larger market structure.
By combining the long-term trend perspective with granular entry precision, multi-timeframe analysis greatly enhances the confidence and success rate of your reversal trading strategies. It ensures you're not fighting the larger market current.
4. Risk management: Protecting your capital when trading reversals
Correctly identifying a turning point is only half the battle. Without robust risk management, even the most accurate predictions can lead to significant losses. Reversal trading inherently involves going against the prevailing trend initially, which can be risky. Therefore, safeguarding your capital should always be your top priority.
4.1. Why risk management is paramount for reversal trading
Reversal trading, while potentially highly profitable due to early entries, carries a higher inherent risk compared to trend-following strategies. You're essentially "catching a falling knife" or "picking a top," meaning there's a real chance the market might continue its current trajectory before a true price reversal occurs.
This is precisely why risk management isn't just a suggestion; it's absolutely paramount. It provides the framework to:
- Limit Losses: A well-defined risk management plan ensures that if a market turning point doesn't materialize as expected, your losses are controlled and don't wipe out your trading capital. This directly impacts your capital protection.
- Preserve Capital: By limiting the size of potential losses on any single trade, you protect your overall trading account from significant drawdown, allowing you to stay in the game for the long run.
- Maintain Emotional Discipline: Knowing your maximum potential loss before entering a trade helps to reduce emotional decisions and keeps you focused on your strategy, even when facing temporary setbacks.
Without stringent risk controls, even a string of successful reversal trades can be undone by a single, unchecked losing trade.
4.2. Setting effective stop losses for reversal trades
One of the most critical components of risk management is setting an effective stop loss. A stop loss is an order to close a trade automatically once a certain price level is reached, limiting your potential loss. For reversal trading, stop losses are your first line of defense against being wrong about a market turning point.
Here are some effective stop loss placement methods for reversal trades:
Below the Reversal Pattern's Low (for long trades) / Above the Reversal Pattern's High (for short trades): This is often the most logical place.
- For a bullish reversal (e.g., Hammer, Double Bottom), place your stop loss just below the lowest point of the reversal pattern or the newly formed swing low.
- For a bearish reversal (e.g., Shooting Star, Double Top), place your stop loss just above the highest point of the reversal pattern or the newly formed swing high.
- This provides a logical trade invalidation point; if price goes beyond this level, your reversal thesis is likely incorrect.
- Using Average True Range (ATR): The ATR stop loss method adapts to market volatility. You can place your stop loss a multiple of the ATR (e.g., 1.5x or 2x ATR) away from your entry price. This ensures your stop is wide enough to avoid being prematurely stopped out by normal market noise but tight enough to limit excessive risk.
- At Key Fibonacci Levels: If your reversal signal occurs near a significant Fibonacci retracement or extension level, placing your stop just beyond that level can be effective. These levels often act as strong support/resistance, and a break below/above them could signal the invalidation of the reversal.
Always set your stop loss before entering the trade. This pre-defines your maximum risk and allows you to calculate your position sizing accurately.
4.3. Position sizing: The key to sustainable trading
Even with a perfect method for finding tops and bottoms, poor position sizing can quickly derail your trading career. Position sizing refers to the number of units you trade, directly determining the amount of capital you risk on any given trade. It's the cornerstone of money management and sustainable trading.
A fundamental rule that I adhere to, and one that many experienced traders follow, is to risk only a small percentage of your total trading capital on any single trade, typically 1% to 2%.
Here’s how it works:
- Determine Your Risk Capital: Decide the maximum percentage of your account you are willing to lose on one trade (e.g., 1%).
- Calculate Your Risk Amount: Multiply your total account balance by your risk percentage. For example, if you have a $10,000 account and risk 1%, your maximum risk per trade is $100.
- Identify Your Stop Loss Distance: Measure the distance in pips from your entry price to your stop loss price.
- Calculate Position Size: Use a position size calculator (easily found online) or a simple formula to determine the lot size (or number of units) that will result in your calculated risk amount, given your stop loss distance.
By strictly adhering to sound position sizing, you ensure that no single losing trade can significantly impact your account. This allows for compounding returns over time and is crucial for trading longevity, enabling you to learn, adapt, and grow as a trader without the fear of blowing up your account.
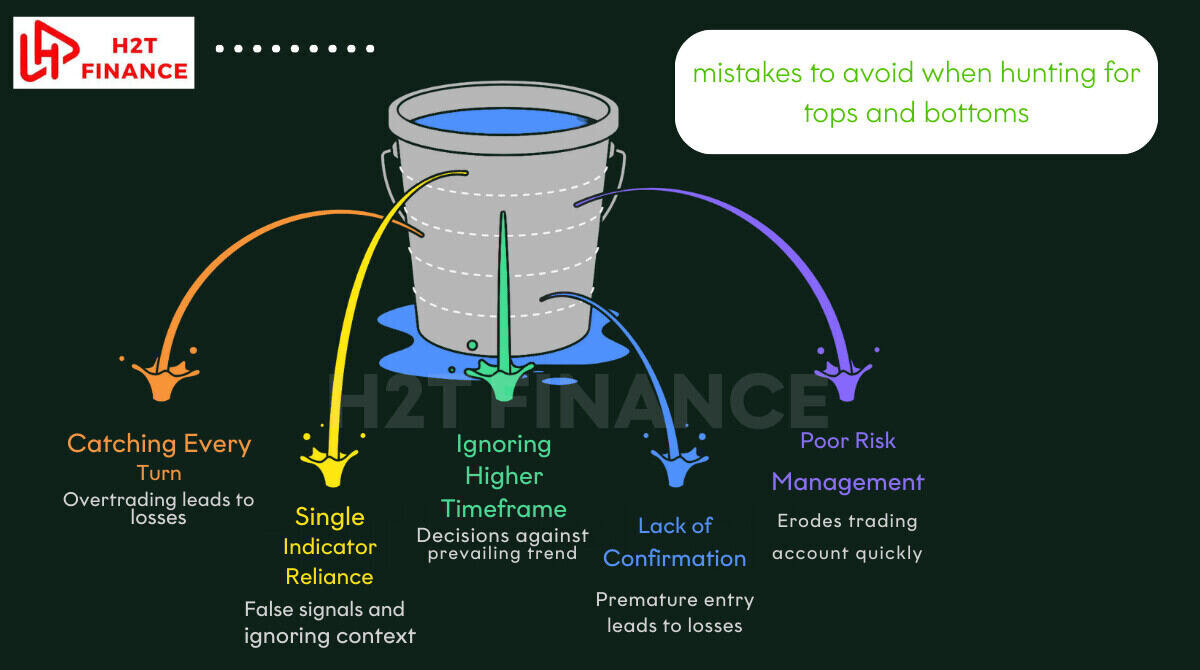
5. Common mistakes to avoid when hunting for tops and bottoms
While the pursuit of mastering market turns can be incredibly rewarding, it's also a path strewn with common pitfalls. Even experienced traders can fall prey to these errors, leading to frustration and losses. Learning to recognize and avoid these missteps is just as crucial as mastering the strategies themselves.
5.1. Trying to catch every single turn
One of the biggest temptations in reversal trading is the desire to catch every single turn the market makes. This leads to overtrading and often results in significant losses. The reality is, not every minor swing high or swing low will develop into a major reversal, and trying to trade them all is a recipe for exhaustion and depleted capital.
- Why it's a mistake: The market generates countless minor price reversal points, many of which are simply temporary pullbacks before the dominant trend resumes. Trying to trade these small turns increases transaction costs and exposes you to more whipsaws and false breakouts.
- The solution: Focus on high-probability setups that align with the confluence of multiple strong signals, ideally at significant key support and resistance levels on higher timeframes. Patience is a virtue in trading; wait for the market to clearly signal its intentions, rather than forcing a trade.
5.2. Relying on a single indicator
As we've discussed, technical indicators are powerful tools, but they are most effective when used in conjunction with others. A common indicator reliance mistake is to base a reversal trade solely on, say, an RSI crossing into an overbought/oversold zone.
- Why it's a mistake: No single indicator is foolproof. Indicators can give false signals, especially in choppy or consolidating markets. Relying on one tool ignores the broader market context and reduces your signal confirmation.
- The solution: Always seek confluence. Combine candlestick patterns, chart formations, and multiple indicators (like RSI divergence with MACD confirmation and volume analysis) to build a stronger case for a market turning point. This layered approach drastically improves the reliability of your reversal signals.
5.3. Ignoring higher timeframe context
A significant error, particularly for newer traders, is to ignore the higher timeframe context of the market. Getting caught up in the minute-by-minute fluctuations of a lower timeframe can lead to making decisions that go directly against the prevailing larger trend, resulting in an expensive timeframe bias.
- Why it's a mistake: A minor reversal signal on a 15-minute chart might simply be a brief pullback within a strong daily trend. Trying to trade a bearish reversal on the 15-minute chart when the daily chart is clearly in a strong uptrend is akin to swimming against a strong current. Your premature entry against the dominant trend is likely to be stopped out.
- The solution: Always start your analysis from a higher timeframe (e.g., daily or 4-hour chart) to understand the overall trend and identify major key support and resistance levels.
Then, drill down to lower timeframes to find precise entry points for your reversal trading strategy that align with the larger market structure. This ensures your trades are in harmony with the dominant forces.
5.4. Lack of confirmation
Entering a trade based on a perceived market turning point without proper confirmation signals is a recipe for disappointment. This premature entry can lead to significant losses as the market might continue in its original direction.
- Why it's a mistake: Just because price reaches a strong resistance level or an indicator shows overbought conditions doesn't guarantee an immediate reversal. The market needs to show genuine signs of a shift in momentum or trend exhaustion before you commit capital.
- The solution: Always wait for confirmation. This could be a clear reversal candlestick pattern closing, a break of a trendline, or the crossing of an indicator's signal line after a divergence. Patience and discipline to wait for these confirming signals are crucial.
5.5. Poor risk management
As discussed in the previous section, neglecting risk management is perhaps the most detrimental mistake a trader can make, especially in the context of reversal trading which inherently carries higher risk. This includes not setting stop losses, setting them too wide or too tight, or not correctly sizing your positions.
- Why it's a mistake: Without proper capital protection and position sizing, a single losing trade or a series of small losses can quickly erode your trading account. This can lead to an impulsive trading mindset, where you chase losses and make even poorer decisions.
- The solution: Always define your maximum risk per trade (e.g., 1-2% of your account) before entering. Place a logical protective stop order, and calculate your position size accordingly. Risk management is not just a rule; it's the foundation of trading longevity.
By consciously avoiding these common errors, you significantly improve your chances of successfully applying reversal trading skills and building a sustainable trading career.
6. My personal insights: Practical tips for mastering reversal trading
Beyond the theories and tools, truly mastering the art of catching tops and bottoms comes down to consistent practice, disciplined execution, and a continuous learning mindset. Having navigated the markets myself, I've gathered some practical insights that I believe are crucial for anyone serious about mastering reversal trading.
6.1. Backtesting & forward testing: Validating your edge
It's one thing to read about strategies; it's another to see them work in action. Before risking real capital, thoroughly backtesting and forward testing your reversal trading strategies is non-negotiable.

- Backtesting: This involves applying your chosen strategy to historical data to see how it would have performed. You can do this manually by scrolling through charts or using specialized software.
I always dedicate significant time to backtest ideas before applying them to live market conditions. This helps you understand the strategy's win rate, risk-reward profile, and typical drawdowns.
- Forward Testing: After backtesting, move to forward testing in a demo environment. This is like a real-time simulation without financial risk. It allows you to see how your strategy performs in current market conditions and helps you get comfortable with execution under pressure.
These two steps are critical for building confidence and validating your analytical edge.
6.2. Journaling your trades: Learning from experience
One of the most powerful tools for self-improvement in trading is often overlooked: the trade journal. Journaling your trades isn't just about recording wins and losses; it's about documenting the "why" behind every decision.
- What to include: For every trade, record the entry and exit points, the specific reversal trading signals you identified (e.g., "Bearish Engulfing at resistance + RSI divergence"), your thought process, your emotional state, and the outcome.
- Why it's crucial: Honestly, the trade journal was the tool I was laziest about keeping, and it was also the mistake that cost me the most. It doesn't just help you find flaws in your strategy; it exposes your inner emotional demons—the greed of entering too early, the fear of cutting a loss too late. Documenting them is the only way to confront them and grow.
6.3. Patience is key: Waiting for high-probability setups
The market is full of noise, and it can be tempting to jump into every perceived market turning point. However, consistently profitable reversal trading demands patience.
- Focus on quality over quantity: Instead of chasing every minor price fluctuation, wait for the clearest, highest-probability setups. These are the ones where multiple trading secrets (confluence of signals) align at significant key support and resistance levels.
- Avoid impulsive trades: Emotional decisions often lead to losses. If a setup doesn't meet all your criteria, simply wait for the next one. The market will always offer new opportunities.
6.4. Adaptability: The market always evolves
The Forex market is dynamic; what worked perfectly last year might need adjustments this year. Successful traders are adaptable.
- Review and adjust: Regularly review your strategies and trading secrets to find tops and bottoms. If you notice a decline in effectiveness, or if market conditions shift significantly (e.g., from trending to ranging), be prepared to adjust your approach or focus on different setups.
- Stay updated: Keep an eye on global economic news and geopolitical events, as these can drastically influence currency movements and the effectiveness of technical patterns.
6.5. Continuous learning: Never stop growing
The journey to mastering trading is endless. There's always more to learn, new tools to explore, and personal habits to refine.
- Embrace new knowledge: Read books, follow reputable analysts, and explore new concepts. The more you understand about market dynamics and trader psychology, the better equipped you'll be.
- Learn from others: While not copying blindly, studying how other successful traders approach market turning points can provide valuable insights and inspire new ideas for your own reversal trading strategies.
By embracing these personal insights and maintaining discipline, you'll not only uncover the trading secrets to find tops and bottoms but also cultivate the mindset necessary for long-term success in the Forex market.
Next steps for aspiring forex brokers:
- How to export data from MetaTrader 4: A step-by-step guide
- How to double my trading account safely? Full guide
- How to draw regrassion channel indicator for MT4: Complete guide
7. Related questions
Here are some common questions traders often ask when exploring trading secrest to find tops and bottoms:
7.1. What are the most reliable indicators for market reversals?
The most reliable indicators often show divergence (e.g., RSI, MACD divergence) or identify overbought/oversold conditions.
However, their reliability drastically increases when confirmed by price action patterns (like Engulfing candles) and occurring at key support and resistance levels.
7.2. How do professional traders identify market tops and bottoms?
Professional traders typically use a combination of confluence strategies, incorporating multi-timeframe analysis, sophisticated chart patterns (like Head and Shoulders), volume analysis, and their deep understanding of trader psychology. They rarely rely on a single indicator.
7.3. Can I use price action alone to find turning points?
Yes, price action alone (candlestick and chart patterns) is a powerful method for identifying market turning points. Many traders successfully trade solely based on price action. However, combining it with other tools (like indicators for confirmation signals) can often increase the probability of success.
7.4. What is confluence in Forex trading and why is it important for reversals?
Confluence is when multiple technical analysis tools or signals align to provide the same directional bias.
It's crucial for reversals because it significantly increases the probability of a successful trade by providing stronger signal confirmation, filtering out weaker setups, and enhancing your confidence.
7.5. Is it always profitable to trade reversals?
No trading strategy is always profitable. Reversal trading is inherently riskier than trend-following because you are initially trading against the prevailing momentum. Success depends heavily on proper risk management, disciplined execution, and waiting for high-probability setups.
7.6. How can I practice finding tops and bottoms without risking real money?
You can practice by using backtesting on historical charts, utilizing demo accounts offered by brokers or platforms like TradingView for forward testing in real-time market conditions, and diligently journaling your trades to learn from your experiences without financial risk.
7.7. How to identify market tops and bottoms?
You can identify them by combining candlestick patterns, chart formations, and technical indicators like RSI or MACD divergence. Tops usually form when buying pressure weakens near resistance, while bottoms appear when selling pressure fades near support.
7.8. What is the 3-5-7 rule in trading?
The 3-5-7 rule suggests using 3 rules for entry, 5 for trade management, and 7 for exit strategies. It emphasizes discipline and structure, ensuring traders follow a systematic approach rather than emotional decisions.
7.9. What is the 90% rule in trading?
The 90% rule refers to the idea that 90% of new traders lose money within their first year. It highlights the importance of risk management, discipline, and continuous learning to avoid becoming part of that majority.
7.10. What is the 5-3-1 rule in trading?
The 5-3-1 rule encourages traders to focus on 5 currency pairs, use 3 strategies, and trade at 1 specific time of day. This framework helps maintain consistency, avoid overtrading, and build mastery in a structured way.
8. Conclusion
The real trading journey isn't about finding a single "secret." Instead, mastering the "trading secrest to find tops and bottoms" is the process of becoming a craftsman—one that requires the patience to wait for a clear signal, the discipline to stick to the plan, and the humility to learn from both wins and losses.
By weaving together technical analysis, an understanding of crowd psychology, and rigorous risk management, you're not just trading reversals you're building true confidence and adaptability in an ever-evolving market.
Ready to put these skills into practice? At H2T Finance, we are committed to empowering you with the knowledge you need. If you're looking to solidify your foundational understanding, be sure to explore our Forex Basics section for comprehensive guides.


