We’ve all felt that jolt of excitement seeing a perfect hammer or shooting star form. But we’ve also felt the sting of jumping in too soon. Here at H2T Finance, our trading team learned a tough lesson: reversal candlestick patterns are just whispers of a potential turn; context is what makes them shout.
One trade still stings. We shorted a parabolic move on a single candle and got squeezed, then watched price finally roll over at the 200-day moving average with volume confirmation. Since then, we wait for location, a clean rejection, and a confirmation candle.
Whether you’re just starting out and typing “What is a reversal candle?” into your search bar, or you’re an active day trader seeking the best reversal candlestick for day trading, this guide is for you. Our goal is to transform reversal candels from mysterious signals into a structured playbook, empowering you to execute trades with confidence on platforms like TradingView or MetaTrader.
Key takeaways:
- Reversal candles signal a potential turn, not a promise; always seek candlestick reversal confirmation before acting.
- Read location first: Strong support/resistance, the 61.8% Fibonacci retracement, or a 200-day moving average often sharpen early signs of market reversal.
- Look for price story: A long wick candlestick that rejects a level, followed by a trendline breakout, carries more weight than an isolated print.
- Plan the trade: Entry rules, a protective stop, and targets with at least a 2:1 risk-reward ratio keep emotions in check.
- Context is crucial across all markets. Forex markets often have more noise, making trend reversal signals in forex clearer on higher timeframes. Similarly, due to high volatility, trading reversal patterns in crypto demands wider filters and careful validation to avoid false signals.
1. Reversal candels explained
When we first heard the term “reversal candle,” it sounded like a magic switch on the chart. In reality, these candlestick patterns are not guarantees but early warnings that momentum may be shifting. Over time, we learned to treat them as road signs: useful, but only if you read the map around them.
1.1. What is a reversal candle?
A reversal candle is a candlestick formation that signals a possible change in the prevailing trend. It reflects a battle between buyers and sellers, showing where control might be slipping. For traders, this is a clue that a downtrend could be losing steam or an uptrend may be hitting exhaustion.
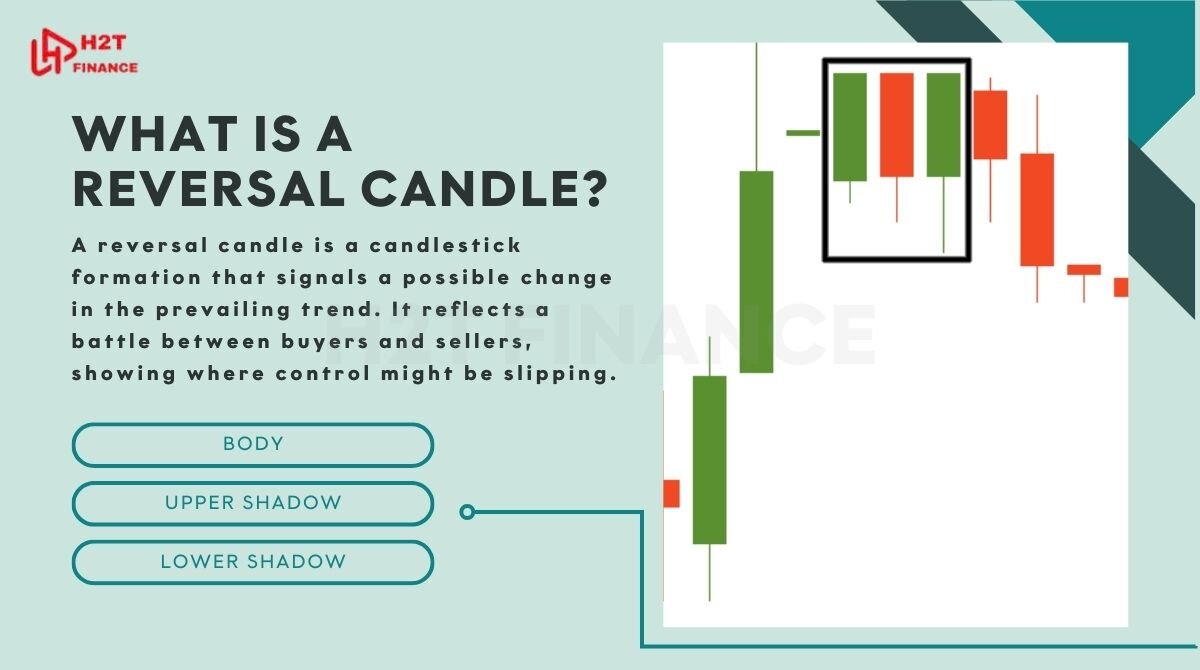
The main parts of a reversal candle include:
- Body: the distance between the open and close. A small body often shows indecision, while a large body can reveal dominance.
- Upper shadow: the high point rejected during the session. In bearish reversal candlestick patterns like the shooting star, this shadow tells us buyers tried but failed to hold control.
- Lower shadow: the low point tested. In bullish reversal candlestick patterns such as the hammer, a long lower wick signals sellers pushed too far before buyers fought back.
From our own trades, one hammer on EUR/USD after a heavy selloff showed how price tested deep into support, then closed strong on the day. Without that long wick, we might have mistaken it for just another weak bounce.
1.2. How reversal candles form
Reversal candles form when market forces clash hard enough to change the narrative. Sellers drive prices lower, only for buyers to step in with conviction. Or buyers push too high, and sellers snap back with heavy volume. These shifts often appear at key zones like the 61.8% Fibonacci retracement or near the 200-day moving average. We’ve seen countless false signals vanish in the middle of a trend but gain power when confirmed by location.
1.3. Bullish vs bearish reversal candles
- Bullish reversal candles: hammer, inverted hammer, morning star, or bullish engulfing. They often appear at the end of downtrends and suggest buying strength is returning.
- Bearish reversal candles: shooting star, hanging man, evening star, or bearish engulfing. They emerge after extended rallies and hint that sellers are taking back control.
In practice, a bullish engulfing at support carries a different weight than the same candle in the middle of nowhere. That context taught us to wait for candlestick reversal confirmation instead of rushing into trades.
Key points:
- Reversal candles are patterns that highlight potential turning points.
- Their structure body, upper shadow, lower shadow reveals the tug-of-war between buyers and sellers.
- Recognizing the difference between bullish and bearish setups, and understanding how they form, lays the groundwork for reading market psychology more accurately.
2. Market psychology behind reversal candles
Every candle hides the emotions of traders. When we began to look beyond the shapes and focused on the story inside, trading felt less random. We’ve felt the sting of false signals and the relief of confirmed ones, so these details matter.
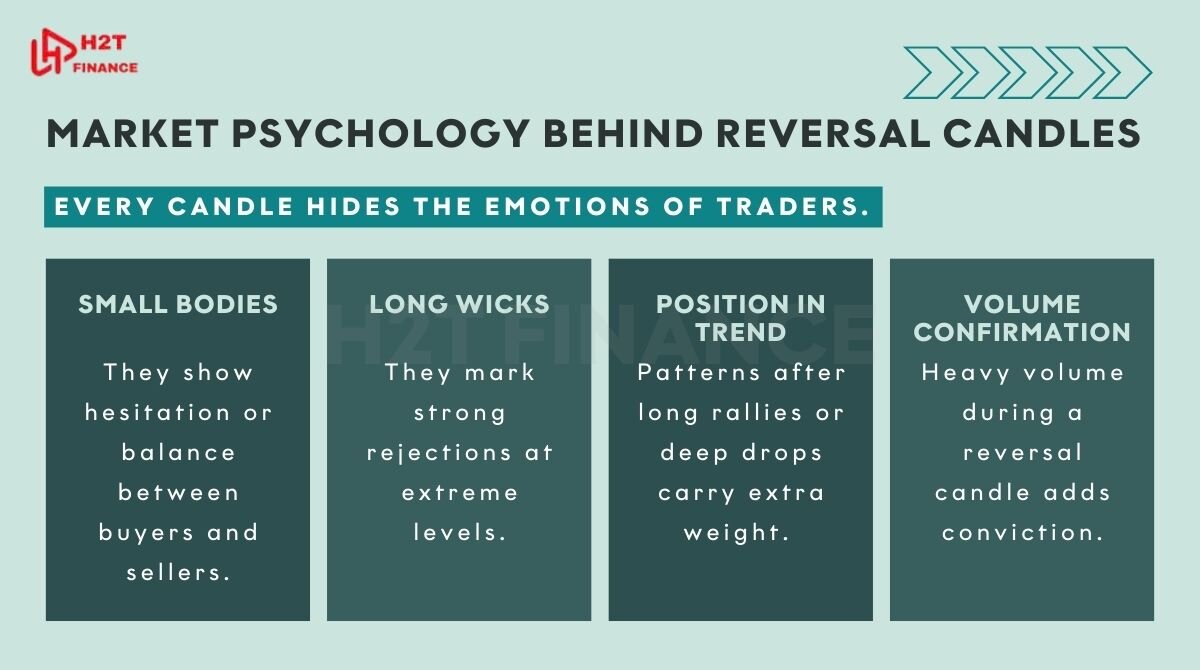
- Small bodies: They show hesitation or balance between buyers and sellers. We’ve watched markets stall like this before breaking out violently, teaching us that indecision can be the calm before the storm.
- Long wicks: They mark strong rejections at extreme levels. A shooting star with a tall upper wick once lured us into chasing the top of an uptrend minutes later, sellers crushed the move. That lesson stuck.
- Position in trend: Patterns after long rallies or deep drops carry extra weight. A hammer after weeks of selling doesn’t just look bullish; it tells us sellers are running out of fuel while buyers are finally stepping in.
- Volume confirmation: Heavy volume during a reversal candle adds conviction. We saw this on oil once, where a hammer with rising volume screamed that buyers weren’t just interested they were determined.
Understanding the candlestick psychology behind reversals is about reading the battle of conviction on the chart. Small bodies reveal hesitation, long wicks signal strong rejection, placement in a trend amplifies meaning, and volume validates strength. For us, learning to read these emotions isn't just a skill, it's a survival tool that has saved us from countless costly mistakes.
3. Popular reversal candles every trader should know
After years of watching charts, we realized that not every candle deserves our attention. A few core formations appear again and again, shaping critical turning points. These are the patterns we trust most when reading the market’s mood.
3.1. Bullish reversal patterns
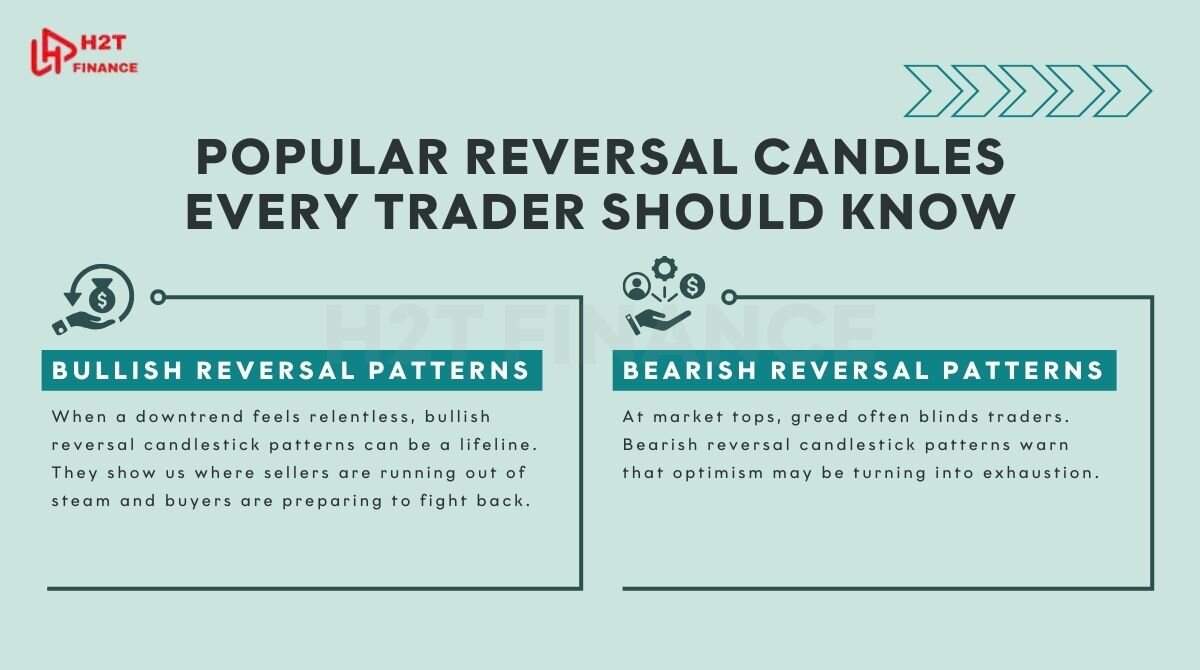
When a downtrend feels relentless, bullish reversal candlestick patterns can be a lifeline. They show us where sellers are running out of steam and buyers are preparing to fight back.
- Hammer: A small body with a long lower wick. We once spotted a hammer on EUR/JPY right after ten straight bearish candles; it marked the exact point where sellers finally gave up, and price bounced sharply.
- Morning Star: A three-candle setup that signals a fresh dawn for buyers. The star in the middle reflects indecision, while the final bullish candle confirms new strength. When this appeared on gold at a major support level, we gained confidence to enter long.
- Bullish Engulfing: A large green candle that swallows the previous red one. This pattern screams conviction. We’ve seen it reclaim broken support levels, backed by surging volume, turning panic into opportunity.
- Piercing Line: A bullish candle that pushes deep into the prior bearish candle. The deeper the penetration, the stronger the message. Traders caught short often scramble here, fueling quick rallies.
- Bullish Harami: A big bearish candle followed by a smaller bullish one. Subtle, almost quiet, but powerful at major support. When the second candle forms as a Doji, it often becomes a serious warning to sellers.
- Inverted Hammer: Appearing in a downtrend with a small body and long upper wick. Even though price falls back, the failed push higher shows buying interest is building under the surface.
- Three White Soldiers: Three strong bullish candles in a row, each closing higher than the last. This is not random, it’s calculated accumulation, and we’ve learned to respect it as a sign of sustained buyer control.
These setups highlight where buyers regain control sometimes subtly, sometimes aggressively. Recognizing them early helps us avoid despair in downtrends and prepare for the shift in momentum.
3.2. Bearish reversal patterns
At market tops, greed often blinds traders. Bearish reversal candlestick patterns warn that optimism may be turning into exhaustion.
- Shooting Star: A small body with a long upper wick at the peak of an uptrend. We once ignored it on Nasdaq and paid the price as sellers crashed the rally.
- Evening Star: The bearish sibling of the Morning Star. That third candle breaking down through the first one’s body often seals the fate of tired bulls.
- Bearish Engulfing: A dominant red candle that swallows the prior bullish candle. Its impact doubles when volume surges, signaling widespread exit from longs.
- Dark Cloud Cover: A bearish candle that closes deep into the body of a prior bullish candle. It feels like sudden storm clouds, shaking confidence after strong rallies.
- Bearish Harami: A large bullish candle followed by a smaller bearish one. While less dramatic, it often whispers the truth: buyers are losing conviction.
- Hanging Man: Appearing after an uptrend, its long lower shadow shows heavy intraday selling pressure. If the next candle confirms lower, the party may be over.
- Three Black Crows: Three consecutive strong bearish candles, each closing near the low. This formation reflects not panic, but persistent selling pressure. We’ve seen it mark the start of deeper downturns in major indices.
These setups reveal fading buying power and increasing selling conviction. Spotting them on time helps us exit gracefully or prepare for short opportunities.
4. How to identify reversal candles accurately
We used to jump at every hammer or engulfing candle we saw. Most of those trades failed, not because the pattern was wrong, but because we ignored context. Over time, we learned that a reversal candle only matters when confirmed by trend, momentum, and price levels.
4.1. Check trend and momentum
Before trusting any candle, ask: what is the bigger picture? A hammer in a raging downtrend may just be a pause, but the same hammer at the end of a tired selloff can be gold. We now combine reversal candlestick patterns with momentum checks to filter noise.
- Trend alignment: If the broader trend is strong, one candle rarely turns the tide. Look for slowing momentum first.
- Volume confirmation: An engulfing candle backed by double the average volume often signals real conviction. We once ignored this on USD/CHF and watched what looked like a false signal turn into a major reversal backed by heavy buying.
- Indicators: Tools like RSI divergence or MACD crossovers give extra weight. When they line up with a reversal candle, confidence grows.
Quick guide:
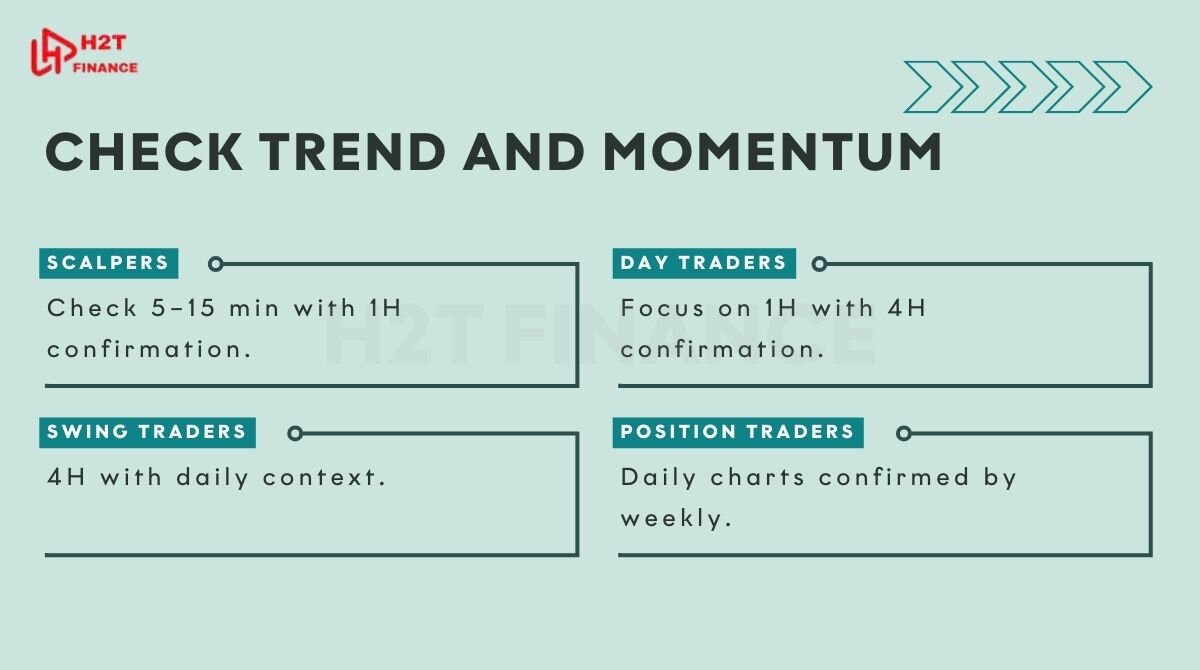
- Scalpers: Check 5–15 min with 1H confirmation.
- Day traders: Focus on 1H with 4H confirmation.
- Swing traders: 4H with daily context.
- Position traders: Daily charts confirmed by weekly.
This layering of timeframes has saved us from chasing fake reversals more than once.
4.2. Analyze price levels
Reversal candles mean little in the middle of nowhere. They shine brightest at zones where price has reacted before. We’ve seen a bearish engulfing at resistance hold far better than the same pattern floating mid-range, especially when confirmed by a support and resistance indicator.
- Support to resistance: Look for failed breaks above. Stops are best placed just above resistance.
- Resistance to support: Watch for higher lows and solid retests. Stops should sit below support.
- Liquidity zones: These dynamic levels often reveal where institutions step in. When a hammer forms there, it feels less like luck and more like deliberate buying.
Accurate identification of reversal candles comes from marrying the pattern with context trend, momentum, and price levels. A candle alone can seduce, but with confirmation, it becomes a weapon.
5. Best tools to spot reversal candles in 2025
We used to scan charts manually for hours, fearing we’d miss the perfect setup. It felt overwhelming, and often we jumped too early. Today, with better tools and smarter methods, we can filter noise and focus only on signals that matter.
5.1. Timeframe analysis methods
The first tool is not software; it’s discipline. Looking at multiple timeframes gives us the bigger picture. A hammer on a 1-hour chart means little if the daily chart is screaming downtrend. But when a bullish reversal candlestick appears on the daily and aligns with a 4H confirmation, the setup feels solid.
- Daily or weekly: Spot major support, resistance, and potential trend reversals.
- 4-hour: Confirm direction and validate if the pattern is genuine.
- 1-hour: Refine entries, catching the precise candle signal.
We learned this top-down approach after missing a massive EUR/USD reversal in 2023. We only watched the 15-minute chart and ignored the weekly level. That mistake taught us patience bigger frames speak louder.
5.2. Pattern detection tools
Technology has made our work easier. Platforms now highlight reversal patterns in real time, sparing us from second-guessing.
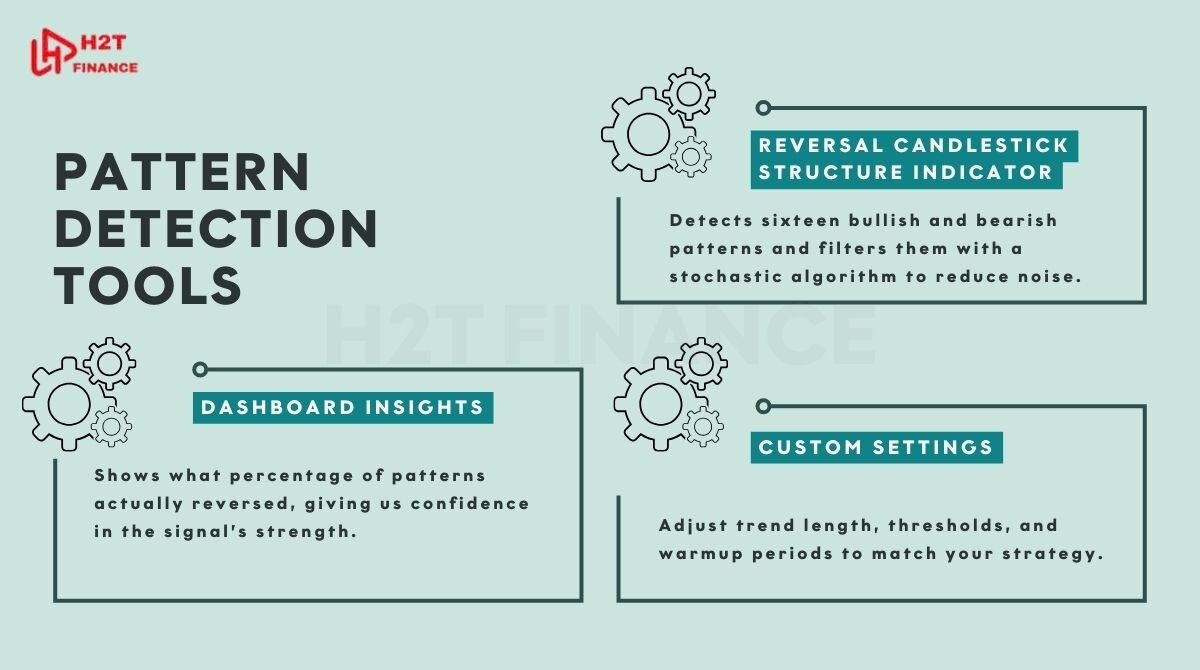
- Reversal Candlestick Structure indicator: Detects sixteen bullish and bearish patterns and filters them with a stochastic algorithm to reduce noise.
- Dashboard insights: Shows what percentage of patterns actually reversed, giving us confidence in the signal’s strength.
- Custom settings: Adjust trend length, thresholds, and warmup periods to match your strategy.
On TradingView, MetaTrader, or Thinkorswim, these tools color-code candles and label patterns directly on the chart. The first time we tested it on gold, the dashboard showed 78% reliability over the past month; it felt like having a second set of eyes.
Spotting reversal candles in 2025 is no longer guesswork. By combining top-down timeframe analysis with modern detection indicators, we filter weak signals and focus on high-probability setups. This blend of structure and tech has given us more confidence and fewer regrets.
6. Trading strategies with reversal candles (for new traders)
We learned quickly that spotting a reversal candle is only half the job. The real challenge is knowing when to enter, when to exit, and how to protect your capital. Too many times we jumped in without a plan and watched good setups slip into painful losses. Over time, we built rules that kept us disciplined.
6.1. Defining entry and exit points
Reversal candlestick patterns can be powerful triggers, but only if we wait for confirmation. Entering too early is like trying to catch a falling knife sometimes it works, most of the time it cuts.
- Bullish Engulfing: Wait for a candle to close above the engulfing high. Place a stop below the low. We once took this setup at a major support on GBP/USD, and the move exploded higher the very next day.
- Bearish Engulfing: Enter after a close below the engulfing low. Stops should sit above the high. This pattern saved us from holding longs too long during the 2022 crypto crash.
- Hammer or Hanging Man: Always wait for the next candle to confirm. Stops belong beyond the wick’s extreme. Without confirmation, these patterns are traps more often than treasures.
Key checks before pulling the trigger:
- Align with the broader trend using higher timeframes.
- Look for volume spikes to confirm conviction.
- Trade only at strong support or resistance zones.
6.2. Risk management rules
Even the best reversal candle setups fail sometimes. What kept us in the game wasn’t chasing wins but managing risk like survival depended on it because it does.
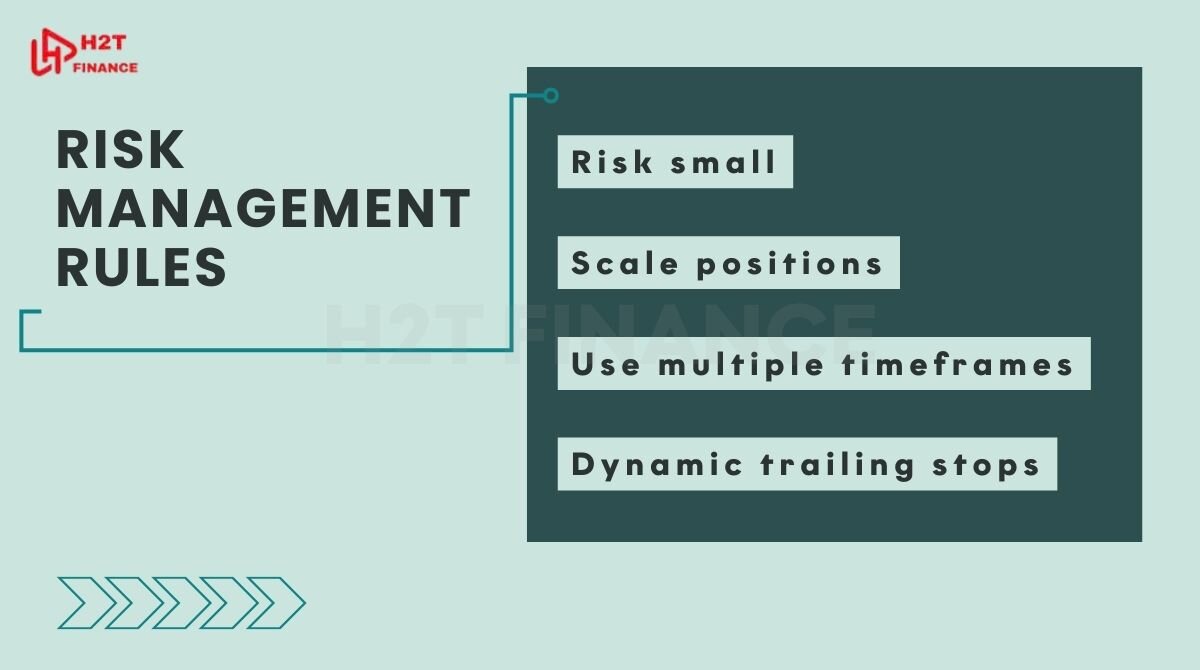
- Risk small: Never risk more than 1–2% of capital per trade.
- Scale positions: Start small and add as confirmation grows.
- Use multiple timeframes: Let higher charts guide the lower ones.
- Dynamic trailing stops: Tools like statistical or volatility-based stops lock in profits without suffocating the trade.
We once traded a Morning Star on AUD/USD. It lined up with a daily support and a 4H momentum shift. By scaling in slowly and trailing our stop, we rode the move without fear of giving it all back.
Trading reversal candles requires discipline. Entries need confirmation, stops protect us from surprises, and risk management keeps losses survivable. With patience and structure, these patterns turn from risky guesses into consistent opportunities.
7. Reversal candles in different markets
We used to think a hammer on forex meant the same as a hammer on stocks. Experience proved us wrong. Each market has its own rhythm, and reversal candlestick patterns behave differently depending on liquidity, volatility, and participant psychology.
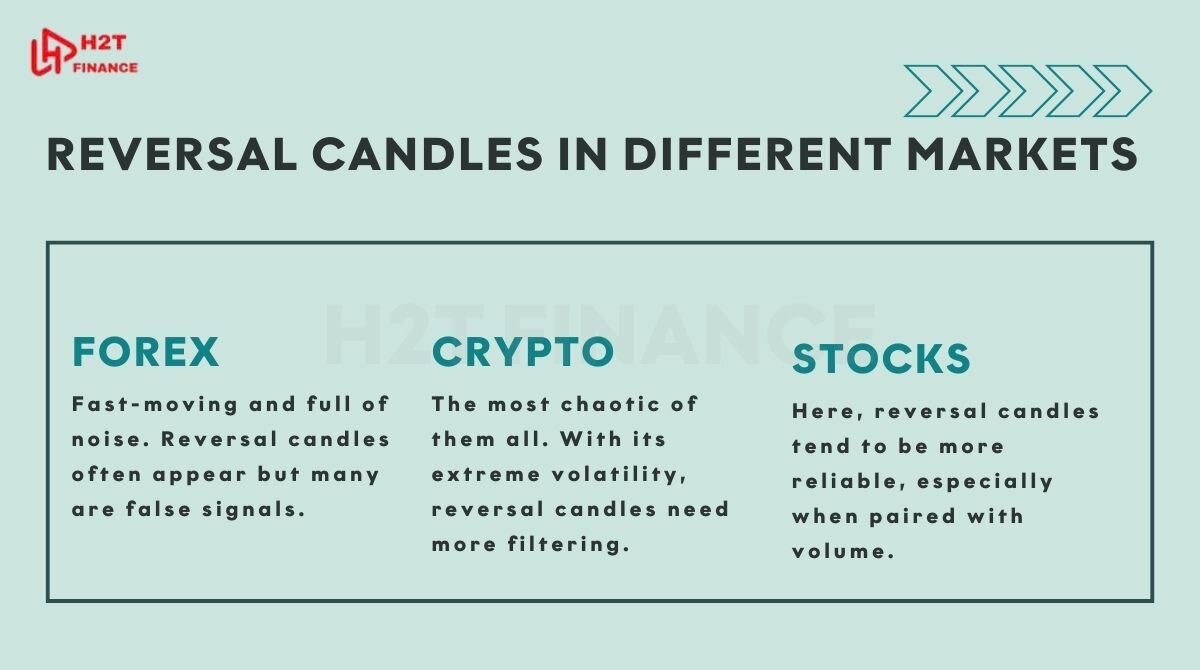
- Forex: Fast-moving and full of noise. Reversal candles often appear but many are false signals. We learned to rely on higher timeframes and confirmation from momentum indicators before committing. A bullish engulfing on a 15-minute EUR/USD chart can be a trap, while the same setup on a daily chart at strong support can be gold.
- Crypto: The most chaotic of them all. With its extreme volatility, reversal candles need more filtering. We found that using 4H or daily charts reduces whipsaws. A shooting star on Bitcoin might look convincing, but without strong volume it often fades within hours.
- Stocks: Here, reversal candles tend to be more reliable, especially when paired with volume. We remember trading Apple shares where a Morning Star with a volume surge marked the end of a correction and the start of a steady rally. Volume acts like a truth detector in equities.
Reversal candles don’t follow a one-size-fits-all rule. Forex demands patience and context, crypto requires higher timeframes to cut through the noise, and stocks reward us most when candles align with volume. Knowing these differences prevents us from treating every signal the same and builds realistic expectations.
8. Common mistakes to avoid with reversal candles
When we first started, reversal candlestick patterns felt like secret weapons. The truth is, they can be just as dangerous as they are useful if handled carelessly. We learned many of these lessons the hard way.
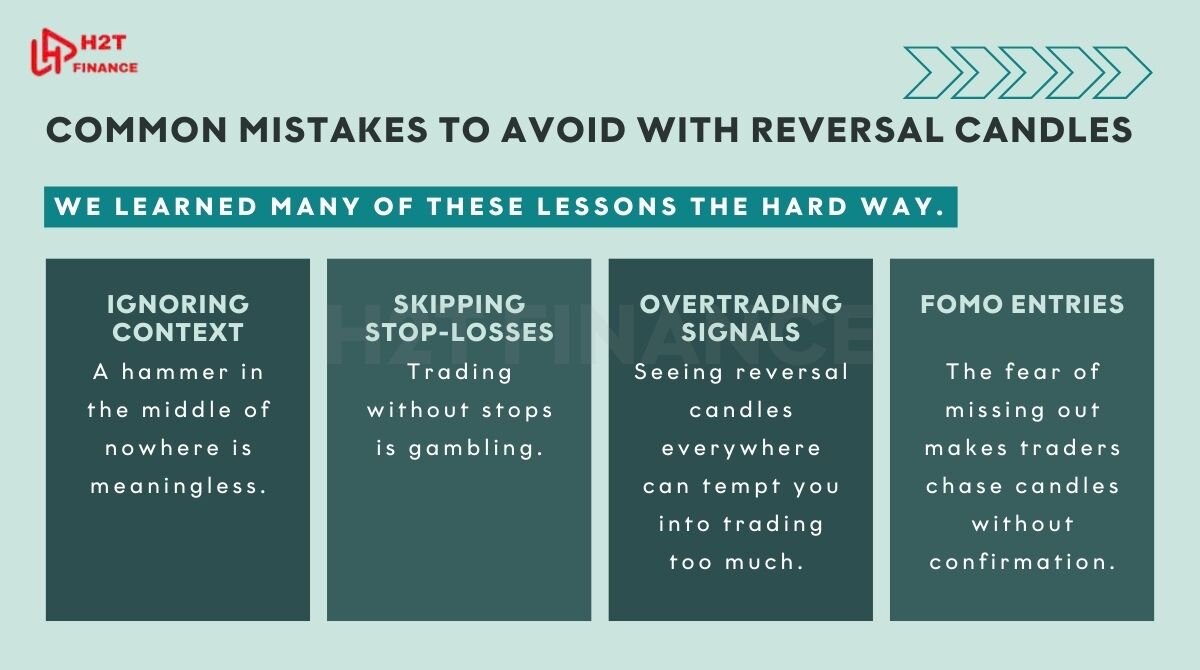
- Ignoring context: A hammer in the middle of nowhere is meaningless. We once bought into what looked like a perfect hammer on USD/JPY, only to watch price collapse further because the broader trend was still bearish. Context is king.
- Skipping stop-losses: Trading without stops is gambling. We once believed a bullish engulfing would never fail until it did, wiping out weeks of gains in a single day. Stops aren’t optional; they’re survival.
- Overtrading signals: Seeing reversal candles everywhere can tempt you into trading too much. We fell into this trap during our early days, jumping at every Doji or star we spotted. Most of them fizzled, leaving us drained and frustrated.
- FOMO entries: The fear of missing out makes traders chase candles without confirmation. We once entered late on a shooting star during a crypto pump. The market reversed, but not before whipsawing us out with a painful loss.
Read more:
The biggest mistakes with reversal candlestick patterns come from impatience and overconfidence. Ignoring context, trading without stops, overtrading, and FOMO are all traps we’ve faced. Avoiding these errors turns reversal candles from dangerous bait into reliable tools.
9. FAQs for new traders
9.1. Are reversal candles accurate?
They are useful but not flawless. Accuracy improves when combined with trend, support/resistance, and volume.
9.2. Which timeframe is most reliable?
Higher timeframes like daily or 4H give stronger signals. Lower charts often create noise and false setups.
9.3. Do I need to combine them with indicators?
Yes. Tools like RSI, MACD, or moving averages add confirmation and filter out weak patterns.
9.4. Should reversal candles be used for entries or exits?
Both. They can mark new entry opportunities or signal exits to lock in profits.
9.5. What is the most powerful reversal candlestick pattern?
Bullish and bearish engulfing patterns are among the most reliable, especially at strong price levels.
9.6. What is the 3-candle reversal strategy?
It involves formations like the Morning Star or Evening Star, where three candles signal a potential turning point.
9.7. Is Doji a reversal pattern?
Not by itself. A Doji shows indecision but can hint at reversal when it appears at key levels with confirmation.
9.8. Which indicator is best for reversal?
No single indicator is best. RSI divergence, MACD crossovers, and volume spikes all work well alongside reversal candles.
10. Conclusion & CTA
Reversal candels are powerful tools for spotting potential turning points, but they are not a magic key. We’ve seen them succeed and we’ve seen them fail what made the difference was context, confirmation, and discipline. Treat them as signals to investigate, not guarantees to trade blindly.
For new traders, the safest path is to practice on demo accounts. Combine reversal candlestick patterns with technical analysis, volume checks, and risk management until you build confidence. The more you test, the more you’ll understand which signals deserve your trust.
At H2T Finance, we believe smart trading comes from structure, not luck. Reversal candles are a vital part of that structure, especially when applied inside a clear trading plan built on price action. Explore more in our Forex Strategies category to deepen your toolkit and keep building your edge.