Most Forex traders know the feeling of a traditional moving average reacting too slowly to a sharp price move. To solve this, indicators need to adapt more quickly to the market's rhythm. A tool designed specifically for this purpose is the range weighted moving average (RWMA), a dynamic indicator that uses price volatility itself to provide clearer signals.
Unlike traditional moving averages that smooth data with a one-size-fits-all approach, the RWMA harnesses the power of volatility, giving weight to price ranges to reflect market sentiment with remarkable clarity.
Whether you're navigating news-driven spikes or tracking subtle trend shifts, this innovative tool offers a fresh perspective, blending responsiveness with reliability.
So, let's explore whether the RWMA is the tool you've been looking for to get a better read on the market.
Key takeaways:
- Dynamic volatility adaptation: The Range Weighted Moving Average (RWMA) uses price range (High − Low) as a weighting factor, making it more responsive to market volatility compared to traditional moving averages like SMA, EMA, or WMA.
- Enhanced trend detection: By prioritizing candles with larger ranges, RWMA captures momentum shifts earlier, ideal for volatile Forex markets or high-impact news events like Non-Farm Payrolls (NFP).
- Versatile applications: RWMA supports various trading styles trend-following, scalping, or swing trading by identifying trends, entry/exit points, and dynamic support/resistance levels.
- Custom implementation required: RWMA isn’t a default indicator on platforms like MetaTrader 4/5 but can be added via custom scripts (e.g., Pine Script for TradingView or MQL5 for MT5).
- Complementary use: Pairing RWMA with indicators like RSI, Bollinger Bands, or MACD enhances signal accuracy and reduces false entries.
- Pros and cons: Offers faster reaction and adaptability but may overfit in low-volatility markets and requires coding knowledge for implementation.
1. Understanding the range weighted moving average
Understanding the range weighted moving average (RWMA) is essential for traders seeking a more adaptive tool in technical analysis.
Unlike traditional moving averages that rely solely on price, RWMA incorporates volatility by using the price range of each period as a weighting factor. This allows the indicator to be more responsive to dynamic market conditions while reducing lag and improving signal clarity.
1.1. What is the range weighted moving average (RWMA)?
The range weighted moving average is a variation of the classic moving average that uses the price range the difference between the high and low of a candlestick as the weight for each data point in the calculation.
Simply put, the RWMA pays more attention to candles with high volatility (wider ranges), assuming those are the moments when market sentiment and momentum are showing their true strength.
Unlike the simple moving average (SMA), which treats all data points equally, or the exponential moving average (EMA), which gives exponentially more weight to recent prices, the RWMA prioritizes price action volatility itself. This makes it particularly effective in markets where sharp price moves are followed by periods of consolidation.
1.2. Why use price range as a weight?
Incorporating the price range into a moving average is grounded in a key assumption: volatility matters.
Periods with larger price ranges often signal higher activity levels, stronger sentiment shifts, or even fundamental news impacts. Traditional moving averages might treat these volatile periods the same as quieter ones, potentially dulling the response to emerging trends.
The RWMA addresses this by assigning higher weights to candles with broader ranges, making the moving average more sensitive to momentum and price acceleration.
This logic is especially valuable in the Forex market, where sudden news-driven movements are common and can distort lagging indicators like the SMA.
1.3. How is the RWMA calculated?
While the RWMA formula may seem complex at first, it can be broken down into a clear step-by-step logic:
- For each time period, calculate the price range = High − Low.
- Multiply the closing price by the range of that period.
- Sum all the (price × range) values over the selected number of periods.
- Sum all the ranges over the same periods.
- Divide the total (price × range) by the total range to get the RWMA.
RWMA formula:
RWMAₜ = Σᵢ₌₁ⁿ (Cᵢ × Rᵢ) / Σᵢ₌₁ⁿ Rᵢ
Where:
- Cᵢ = Closing price of the i-th period
- Rᵢ = Range (High – Low) of the i-th period
- n = Number of periods
- t = Current period
The end result of this formula is very intuitive: candles with high volatility get a bigger "vote" in shaping the moving average. This effectively turns the RWMA into a trend filter that's truly responsive to market shifts.
1.4. How does RWMA compare to SMA, WMA, and EMA?
To truly appreciate the uniqueness of RWMA, it helps to compare it with the most common types of moving averages:
| Type | Weighting Logic | Responsiveness | Volatility Adaptation |
| Simple Moving Average (SMA) | Equal for all periods | Low | None |
| Weighted Moving Average (WMA) | Linear, favors recent prices | Medium | None |
| Exponential Moving Average (EMA) | Exponential, favors recent prices | High | Minimal |
| Range Weighted Moving Average (RWMA) | Based on price range per candle | Medium–High | Yes (Fully adaptive) |
- SMA is smooth but slow, suitable for identifying long-term support or resistance.
- EMA and WMA speed up reactions by emphasizing recent prices, useful in fast-moving markets.
- RWMA, however, goes further by adapting to price volatility, making it highly relevant in Forex where volume data is limited and range-based volatility is often more telling.
2. How to calculate the range weighted moving average (with example)
Calculating the range weighted moving average (RWMA) may appear complex at first, but once broken down into steps, it's both logical and highly intuitive. This section provides a simple, structured approach to help you understand and apply RWMA in your Forex analysis even if you're not a math expert.
2.1. Step-by-step: RWMA formula explained
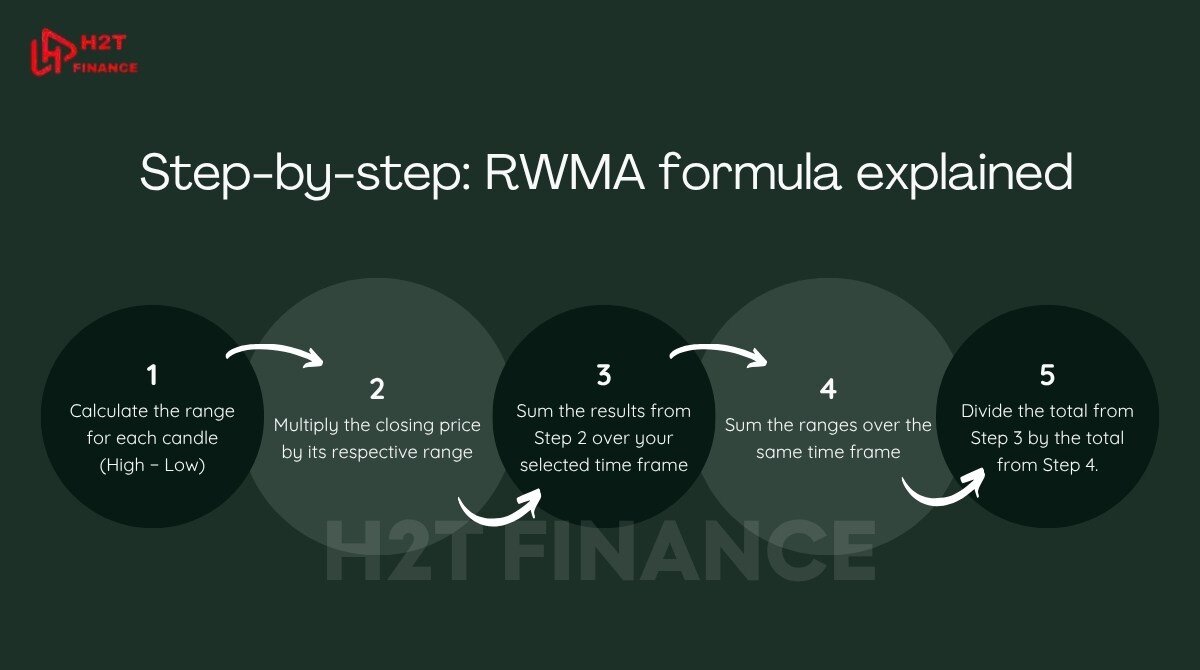
The RWMA gives more weight to candles with wider price ranges. Here’s a simplified way to calculate it:
- Calculate the range for each candle (High − Low).
- Multiply the closing price by its respective range.
- Sum the results from Step 2 over your selected time frame.
- Sum the ranges over the same time frame.
- Divide the total from Step 3 by the total from Step 4.
Formula:
RWMA = Σ(Close × Range) / Σ(Range)
This formula ensures that volatile candles have a stronger impact on the average, enhancing the indicator’s responsiveness to meaningful price action.
2.2. Example: Calculating RWMA on 5 periods
Let’s walk through a practical example using 5 candlesticks. Assume we’re analyzing EUR/USD:
| Date | Close Price | High | Low | Range (High − Low) | Weighted Value (Close × Range) |
| June 17 | 1.0910 | 1.0930 | 1.0890 | 0.0040 | 0.004364 |
| June 18 | 1.0885 | 1.0900 | 1.0860 | 0.0040 | 0.004354 |
| June 19 | 1.0905 | 1.0915 | 1.0880 | 0.0035 | 0.00381675 |
| June 20 | 1.0870 | 1.0885 | 1.0855 | 0.0030 | 0.003261 |
| June 21 | 1.0860 | 1.0875 | 1.0840 | 0.0035 | 0.003801 |
| Total | 0.0180 | 0.01959675 |
RWMA = Total Weighted Value / Total Range = 0.01959675 / 0.0180 = 1.088708 (rounded)
This RWMA value (1.088708) is more sensitive to the wider-ranged candles (June 17 & 18), giving more weight to volatility rather than treating all candles equally.
2.3. RWMA vs. SMA on the same data
Let’s compare this with a simple moving average (SMA) using the same closing prices:
SMA = Σ(1.0910 + 1.0885 + 1.0905 + 1.0870 + 1.0860) / 5 = 1.0886
Though the values are close, RWMA (1.0887) slightly favors the candles with stronger movement, while SMA simply averages everything. This small difference can be crucial in short-term decision-making, especially in fast-moving Forex markets.
2.4. Bonus: RWMA in TradingView
While MetaTrader 4/5 doesn’t support RWMA by default, TradingView offers a flexible scripting environment. Here's a simple Pine Script snippet to implement RWMA manually:
//@version=5
indicator("Range Weighted Moving Average", overlay=true)
length = input.int(14, minval=1)
range = high - low
num = ta.sum(close * range, length)
den = ta.sum(range, length)
rwma = num / den
plot(rwma, color=color.teal, title="RWMA")
Just paste this into the Pine Script editor, and you'll get a real-time RWMA line plotted on your chart.
3. Range weighted moving average vs other moving averages
In the world of technical indicators, not all moving averages are created equal. While the simple moving average (SMA), exponential moving average (EMA), and weighted moving average (WMA) are well-established tools, the range weighted moving average (RWMA) brings a fresh and dynamic approach especially useful in volatile Forex markets.
In this section, we’ll explore how RWMA compares to its traditional counterparts and when each is most useful.
3.1. Key differences between RWMA, SMA, EMA, and WMA
Understanding the core logic behind each type of moving average is essential to selecting the right one for your trading strategy. The table below breaks down the key features:
| Feature | SMA | EMA | WMA | RWMA (main keyword) |
| Weight logic | Equal | Exponential | Linear (recent-heavy) | Based on price range (volatility) |
| Sensitivity | Low | High | Medium | Medium–High |
| Volatility adaptation | No | Partial | No | Yes |
| Use case | Long-term trends | Short-term entries | Mid-term trades | Volatile market conditions |
3.2. What makes RWMA stand out?
Before choosing a moving average, it's important to understand how each responds to market conditions. RWMA differs because it reacts to price volatility, not just price direction.
- SMA gives equal weight to each price and is slow to react.
- EMA reacts faster but can overemphasize recent noise.
- WMA improves responsiveness but doesn’t consider volatility.
- What truly sets the RWMA apart is that it looks beyond just the closing price. By factoring in the price range, it becomes capable of adjusting to volatility on its own. This means you can use it to spot trends a little earlier, filter out weak signals in sideways markets, and build strategies that need to be responsive without getting thrown off by too much noise.
3.3. Visual example: Comparing MA indicators on a Forex chart
In the chart, RWMA tends to hug the price more closely during spikes in volatility, while the SMA lags and smooths too much. This responsiveness can give Forex traders an edge especially in time-sensitive trades such as news trading or scalping.
3.4. When should you use RWMA instead of others?
Choose RWMA if:
- You’re trading in high-volatility environments (e.g., NFP week, CPI reports).
- You want a dynamic average that adapts to price action without overfitting.
- You need a custom indicator that balances sensitivity and smoothness.
Choose SMA/EMA/WMA if:
- Your platform doesn’t support scripting or custom indicators.
- You’re backtesting common strategies with standardized tools.
- Your focus is on simplicity and broader market direction.
4. How to use RWMA in forex trading
The range weighted moving average (RWMA) isn’t just a visual tool it’s a functional part of real-world trading strategies. Whether you trade intraday, swing, or react to news-driven volatility, RWMA can enhance your analysis by offering clearer signals, stronger filters, and better decision-making.
Below, we’ll walk through how to integrate RWMA into your Forex trading toolkit.
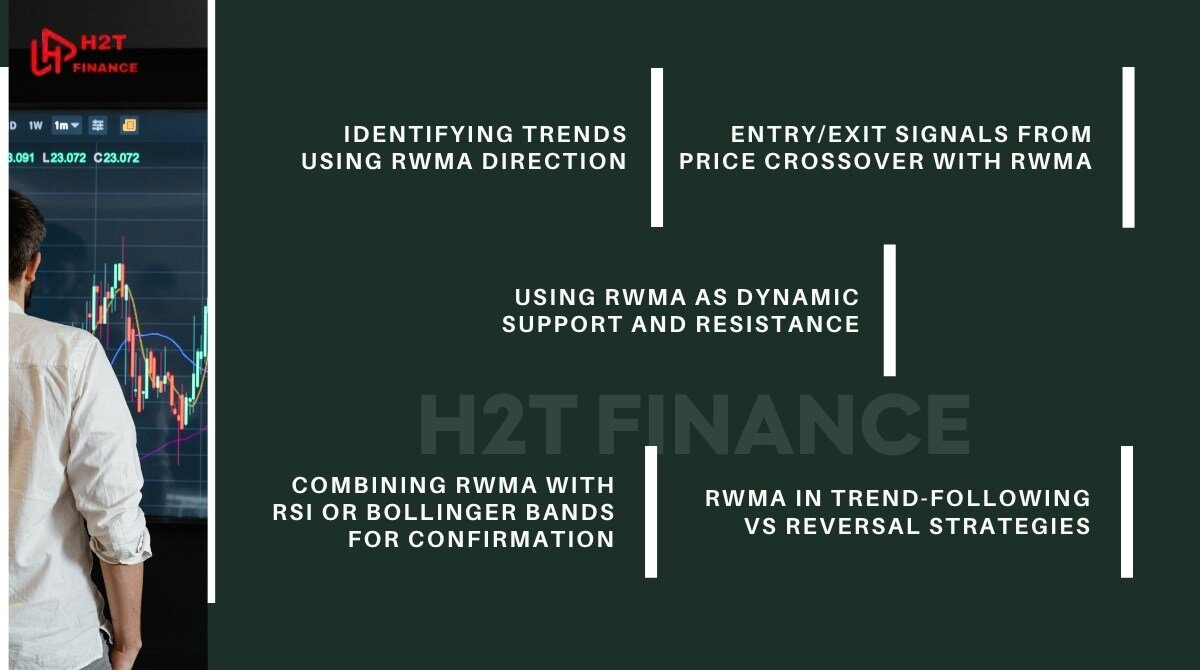
4.1. Identifying trends using RWMA direction
Like other moving averages, RWMA helps smooth out price data. But its volatility weighting makes it more reactive especially during market spikes.
- Upward slope of RWMA → bullish momentum
- Downward slope of RWMA → bearish momentum
- Flat RWMA → ranging or consolidating market
Because RWMA reacts more to volatility than SMA or EMA, it often identifies trend shifts earlier, especially after news events or breakouts.
4.2. Entry/exit signals from price crossover with RWMA
One of the most practical uses of RWMA is identifying entry or exit points when price crosses the line:
- Bullish signal: Price crosses above the RWMA and closes → potential buy setup
- Bearish signal: Price crosses below the RWMA and closes → potential sell setup
4.3. Using RWMA as dynamic support and resistance
Due to its responsive nature, RWMA can act as a dynamic support or resistance level:
- In uptrends, RWMA often serves as support: a pullback to the RWMA followed by a bounce is a classic entry setup.
- In downtrends, it can become resistance: price failing to break above the RWMA suggests continuation downward.
This function works well when combined with price action patterns, like pin bars or engulfing candles near the RWMA.
4.4. Combining RWMA with RSI or Bollinger Bands for confirmation
To filter out false signals, RWMA works best when paired with other technical indicators:
- RSI: Confirm overbought/oversold conditions to reinforce RWMA trend signals.
- Bollinger Bands: Use RWMA to track directional bias while Bollinger Bands show volatility expansions.
- MACD: Combine RWMA trend direction with MACD crossovers for higher probability setups.
4.5. RWMA in trend-following vs reversal strategies
Whether you’re a trend follower or a contrarian, RWMA has use cases:
| Strategy type | How to use RWMA |
| Trend-following | Enter in direction of RWMA slope after pullbacks to the average |
| Reversal | Spot exhaustion patterns after sharp RWMA slopes and price divergence |
RWMA doesn’t guarantee success but it can help filter trades, reduce noise, and build more logic-driven entries.
5. RWMA for volatile market conditions
One of the most compelling reasons to use the range weighted moving average (RWMA) is its built-in ability to adapt to market volatility.
Unlike traditional moving averages, which can lag significantly or smooth out too much during periods of turbulence, RWMA assigns greater weight to candles with higher price ranges.
Personally, I find that the RWMA really shines during major news weeks, like with the Non-Farm Payrolls (NFP) report. While a standard SMA might lag and get chopped around, the RWMA tends to hug the price action much more closely, giving me a clearer picture of the real strength behind a breakout.
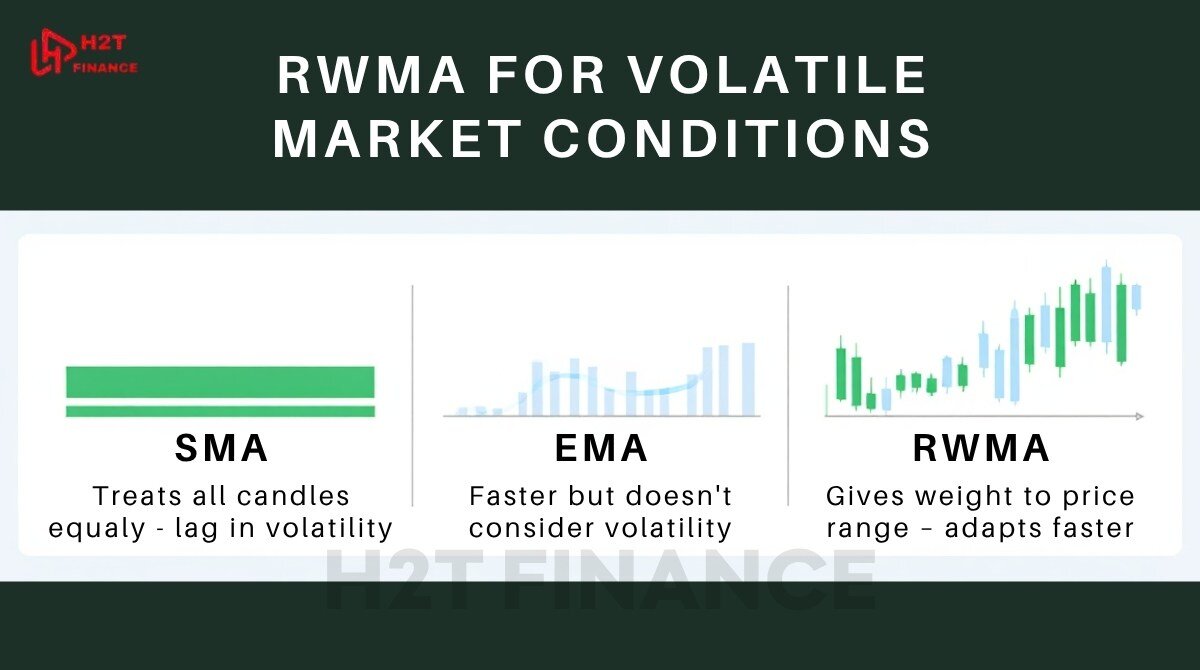
5.1. How RWMA responds to volatility better than SMA/EMA
Volatile markets are characterized by sharp, sudden price movements. During such times:
- SMA continues to treat all price points equally, creating lag.
- EMA attempts to react faster but doesn’t factor in volatility directly.
- RWMA, however, gives more weight to wide-ranging candles, making it more sensitive during volatile periods without entirely overreacting to noise.
This responsiveness allows traders to see trend changes sooner and filter out low-quality trades during choppy conditions.
5.2. Example: applying RWMA during a high-impact news event
Let’s say the U.S. releases a stronger-than-expected Non-Farm Payrolls (NFP) report. The EUR/USD pair reacts with a large bearish candle, followed by wild intraday swings.
- A 14-period SMA might not adjust quickly enough to reflect the trend shift.
- A 14-period RWMA, however, will immediately factor in the large range from the NFP candle adjusting the moving average downward and potentially signaling an earlier bearish trend formation.
This allows intraday traders to enter earlier or tighten stop-losses based on updated volatility conditions.
5.3. Adapting lot size and SL/TP using RWMA feedback
The dynamic nature of RWMA also makes it useful for risk management:
- Stop-loss (SL): During high volatility, traders can place SL just beyond the RWMA to allow breathing room while maintaining logical structure.
- Take-profit (TP): RWMA slope can help set realistic TP targets that align with the trend’s strength.
- Lot size: Traders using RWMA as part of a volatility-adjusted system can reduce position size when the range increases, helping control risk exposure.
5.4. Use case: day trading vs swing trading with RWMA
RWMA can be tailored to different styles:
| Style | RWMA usage |
| Day trading | Use short-period RWMA (e.g. 10–20) to respond quickly to volatile intraday movements. |
| Swing trading | Use longer RWMA (e.g. 50+) to track sustained volatility trends over multiple sessions. |
Because RWMA adjusts based on price range, it gives both scalpers and swing traders a clearer structure for adapting to current market dynamics.
6. Pros and cons of using RWMA
Every trading indicator has its strengths and limitations, and the range weighted moving average (RWMA) is no exception. While RWMA offers a fresh, volatility-aware approach to trend detection, traders should be aware of when it shines and when it might fall short.
This section explores the key advantages and disadvantages of using RWMA in real-world trading.
6.1. Advantages of using the range weighted moving average
RWMA has several unique benefits that set it apart from traditional moving averages like SMA, EMA, and WMA:
- Faster reaction to price volatility: By emphasizing candles with a larger range, RWMA responds more dynamically to sudden market moves, helping traders stay ahead of momentum shifts.
- Adaptive to market noise: Unlike rigid indicators, RWMA adjusts its sensitivity based on the natural rhythm of the market, providing a more accurate reflection of price behavior especially during uncertain conditions.
- Clearer trend structure: RWMA smooths price data while still capturing essential volatility cues, offering traders a more precise picture of the underlying trend without over-smoothing critical turning points.
- Versatile for different strategies: Whether you're trend-following, scalping, or swing trading, RWMA’s customizable parameters make it a flexible tool for various strategies and timeframes.
6.2. Limitations of the range weighted moving average
Despite its strengths, RWMA is not without drawbacks:
- Not available by default on popular platforms: Unlike SMA or EMA, RWMA usually requires custom scripting or third-party indicators, especially on MT4 or MT5.
- Custom implementation needed: Traders must use Pine Script (for TradingView) or custom MQL5 code (for MetaTrader) to integrate RWMA into their workflow, which can be a barrier for beginners.
- May overfit in low-volatility conditions: During extremely quiet or low-range markets, RWMA may exaggerate small price fluctuations, potentially leading to false signals or premature entries.
- Less academic research and adoption: Since RWMA is a newer and less conventional indicator, there’s limited academic study or mainstream support compared to EMA or SMA.
6.3. Is RWMA worth the complexity?
For traders who are comfortable using custom indicators and want a more responsive, volatility-aware tool, RWMA can be a game-changer. However, it’s not ideal for those who prefer simplicity or who rely solely on standard charting platforms without customization.
7. How to add RWMA to MT5 or TradingView
While the range weighted moving average (RWMA) offers clear benefits in volatile markets, it's not yet included as a standard indicator in platforms like MT4 or MT5.
However, you can still integrate RWMA into your trading workflow using custom scripts or community-built tools especially on platforms like TradingView and the MQL5 marketplace.
Here’s how you can get started.
7.1. Is RWMA available by default?
- MetaTrader 4 (MT4) and MetaTrader 5 (MT5): RWMA is not available by default. You'll need to either code it yourself or download a custom indicator from the MQL5 Code Base or Forum.
RWMA isn’t part of the standard indicator library in MetaTrader platforms
- TradingView: TradingView does not include RWMA in its built-in indicators, but several user-published scripts are available for free. These scripts use Pine Script to implement RWMA logic.
7.2. Using TradingView custom scripts
To use RWMA on TradingView:
- Go to the Indicators panel.
- Click on Community Scripts.
- Search for “Range Weighted Moving Average” or “RWMA”.
- Look for scripts with good ratings and reviews (e.g., by trusted script authors).
- Click Add to Chart.
Tip: Hover over the script name to view its source code if you’d like to understand or customize the logic.
7.3. Example: RWMA Pine Script (simplified version)
//@version=5
indicator("Range Weighted Moving Average", overlay=true)
length = input.int(14, minval=1)
price = close
range = high - low
sum_weight = 0.0
sum_value = 0.0
for i = 0 to length - 1
w = range[i]
sum_weight := sum_weight + w
sum_value := sum_value + price[i] * w
rwma = sum_value / sum_weight
plot(rwma, color=color.orange, title="RWMA")
This code creates a basic 14-period RWMA using candle ranges as weights.
7.4. Adding RWMA to MT5 using custom indicators
If you’re using MT5:
- Visit www.mql5.com and search for "Range Weighted Moving Average."
- Choose a verified script (free or paid) from the Code Base.
- Download and place it into your Indicators folder in MetaEditor.
- Compile the script and apply it to your chart from the Navigator panel.
Alternatively, you can ask a developer to write a custom indicator based on your RWMA specifications if none of the available ones match your needs.
7.5. Simulating RWMA with alternative indicators (for MT4 users)
If you're unable to find RWMA for MT4, you can approximate it using a custom WMA with volatility filters or manually calculate the weighted values using Excel or Google Sheets based on candle ranges.
While this isn’t ideal, it allows traders on legacy platforms to benefit from RWMA logic without switching tools entirely.
8. Related questions about RWMA ( FAQS )
To support search visibility and address common user queries, here are some frequently asked questions about the range weighted moving average (RWMA) along with quick answers and in-depth clarifications.
8.1. What is the difference between RWMA and EMA?
RWMA uses price range as a weighting factor, while EMA gives exponentially more weight to recent prices.
While both RWMA and EMA are more responsive than SMA, they use different logic. EMA applies a constant multiplier to emphasize recent price changes. In contrast, RWMA dynamically adjusts its sensitivity based on the size of the price range in each candle.
This makes RWMA more adaptive to volatility, whereas EMA simply smooths the latest price actions.
8.2. Is RWMA better for volatile markets?
Yes, RWMA is designed to perform better in volatile conditions by giving more weight to high-range candles.
Traditional moving averages treat all periods equally or by time-based decay. RWMA is different; it emphasizes candles with larger ranges, which often reflect strong market activity. This makes it ideal for news trading, high-volatility pairs, and sudden trend reversals, where capturing momentum quickly is crucial.
8.3. Can RWMA be used for scalping?
Yes, but with caution it can help identify sharp moves, but may overreact in choppy markets.
Scalpers can benefit from RWMA's fast reaction to volatility. However, since range-based weighting may amplify noise in low-time frame charts, combining RWMA with filtering tools like RSI or VWAP can improve accuracy. Always backtest before applying RWMA in short-term trading strategies.
8.4. How do I code RWMA in Pine Script or MQL5?
RWMA can be coded using a loop that multiplies each price by its range and divides the total by the sum of ranges.
In Pine Script (for TradingView), RWMA is implemented by iterating over the last N candles and calculating a weighted sum using the candle range as a multiplier. For MQL5, the logic is similar but uses C++-like syntax. If you’re not familiar with coding, you can download pre-written scripts from community libraries.
8.5. What are the best indicators to combine with RWMA?
Combine RWMA with RSI, Bollinger Bands, MACD, or ATR for confirmation and filtering.
Think of the RWMA as your primary guide for the trend's direction. Then, use other indicators to confirm what it's telling you.
For instance, check the RSI to make sure you aren't buying into an overbought market, or look at the MACD to see if momentum is actually backing up the trend the RWMA is showing. Combining them this way helps build confidence and cut down on bad calls.
9. Final thoughts: Is the RWMA worth using in your trading strategy?
The range weighted moving average (RWMA) stands out as a versatile and volatility-aware tool, shining brightest in markets where sharp price movements demand quick, precise analysis. It excels during high-impact events like Non-Farm Payrolls or CPI releases, offering traders a clearer lens to spot trend shifts and filter noise.
Intraday traders chasing rapid price swings, swing traders seeking sustained trends, and volatility-based systems will find RWMA particularly valuable for its adaptive nature.
However, like any indicator, its true potential unfolds when paired with robust risk management tools, think dynamic stop-losses, realistic take-profit targets, and position sizing aligned with market conditions.
Before integrating RWMA into your live trades, test it thoroughly on a demo account to understand its nuances. Combine it with complementary indicators like RSI or Bollinger Bands to confirm signals and reduce false entries.
In summary, understanding and applying the range weighted moving average (RWMA) can offer a significant edge, especially in volatile markets. Testing and integrating it into your system is the next logical step.
This aligns perfectly with our philosophy at H2T Finance: within our Forex Basics category, we focus on providing practical knowledge so you can build a more confident and effective trading strategy for yourself.


