Seeing a candle with a long wick often makes traders pause. Is it signaling a reversal, or just noise on the chart? We've all felt that surge of excitement and hesitation. The truth is, a long wick candlestick is a powerful sign of price rejection.
Imagine a battle where one side pushes with all its might, only to be crushed and forced back, leaving a clear footprint of its defeat. That's the story a long wick tells. Whether it's a long upper wick candlestick or a long lower wick, it's not just a line on a chart; it's a footprint of struggle, a clear sign of who lost control.
In this guide, we will analyze the core principles behind long wicks on candlesticks, provide clear examples of this powerful candlestick pattern, and introduce effective strategies for how to trade long wicks on candlesticks systematically — a method widely applied across forex markets.
Key takeaways:
- Long wicks on candlesticks reveal price rejection and can hint at reversals.
- A long upper wick often signals selling pressure, while a long lower wick reflects buyer strength.
- Popular long wick candle patterns include hammer, shooting star, and doji variations.
- Trading long wick candlesticks works best with confirmation, support/resistance, and volume.
- They are not foolproof context, risk management, and practice on demo accounts are essential.
1. What is a long wick candle? Basic structure explained
A long wick candle is more than just a line on a chart; it is a significant signal from the market, indicating a potential shift in sentiment that could lead to a reversal.
1.1. What is a long wick candle? Definition and structure of long wick candles
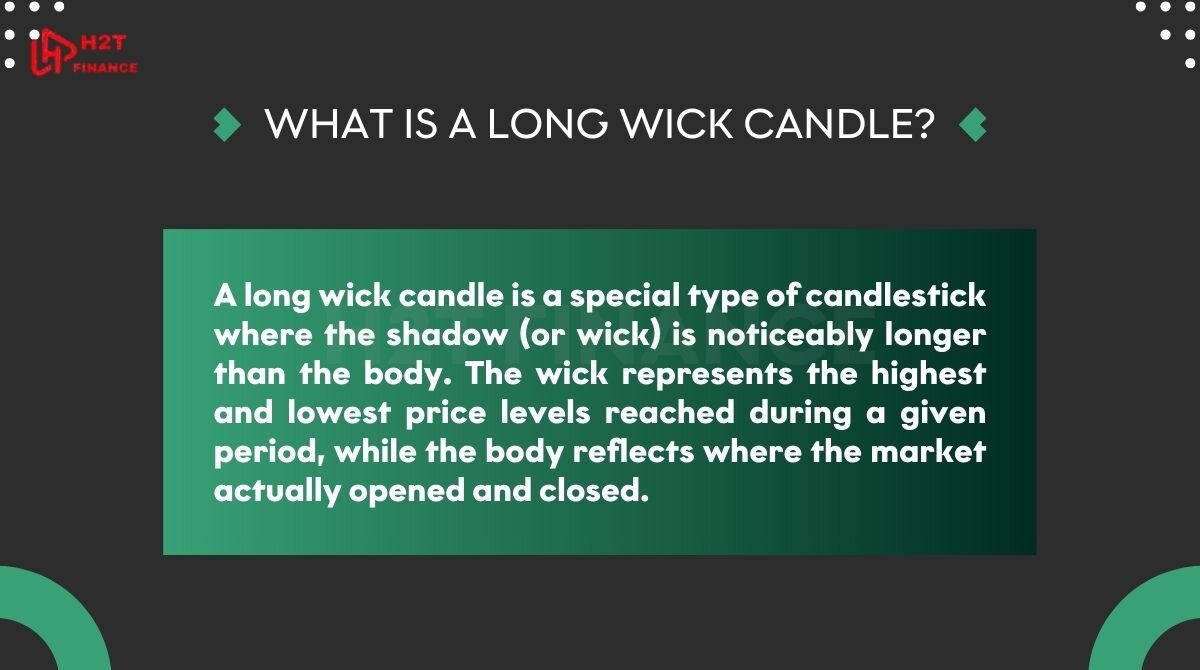
A long wick candle is a special type of candlestick where the shadow (or wick) is noticeably longer than the body. The wick represents the highest and lowest price levels reached during a given period, while the body reflects where the market actually opened and closed.
The longer the wick, the stronger the sign of price rejection. For example, when we see a green candle with a long upper wick, it often means buyers pushed prices higher but sellers forced them back down before closing. On the other hand, a long lower wick candle highlights how sellers tried to drive price lower but were overwhelmed by buying pressure.
From our trading experience, this simple detail has saved us from entering weak setups many times. It’s not about memorizing patterns, it's about reading who is winning the tug-of-war in that moment.
1.2. Colors and components of long wick candles
Color matters as much as shape. A green candlestick signals that the closing price was above the opening, showing bullish intent. A red candlestick means the opposite of the price closed below where it started, suggesting bearish control.
Equally important is the length of the body compared to the wick. A small body with a very long upper wick often shows fading bullish momentum, while a long lower wick candle suggests failed selling pressure. By looking at both, traders can better interpret whether the market is leaning bullish, bearish, or neutral.
When comparing long upper wick vs long lower wick:
- Long upper wick candlestick: sellers pushed back after buyers reached a high, often a bearish sign.
- Long lower wick candlestick: buyers stepped in strongly after heavy selling, often a bullish sign.
In both cases, the wick is not just a line on the chart, it is the footprint of fear, greed, and rejection happening in real time.
Key points:
- A long wick candlestick shows strong rejection from buyers or sellers.
- The wick reflects high and low prices, while the body shows open and close.
- Green and red colors reveal who controlled the session.
- Long upper wick candlestick often signals selling pressure; long lower wick candle suggests buying strength.
- The length of both body and wick helps reveal the balance of market psychology.
2. Analysing market conditions through candle wicks
When a candle leaves behind a long wick, it's like a whisper of a battle fought and lost. By studying these silent signals, we can feel the shift in power, sense the market's hesitation, and even spot the traps laid for those foolish enough to act on impulse.
2.1. Bullish long wick (long lower shadow)
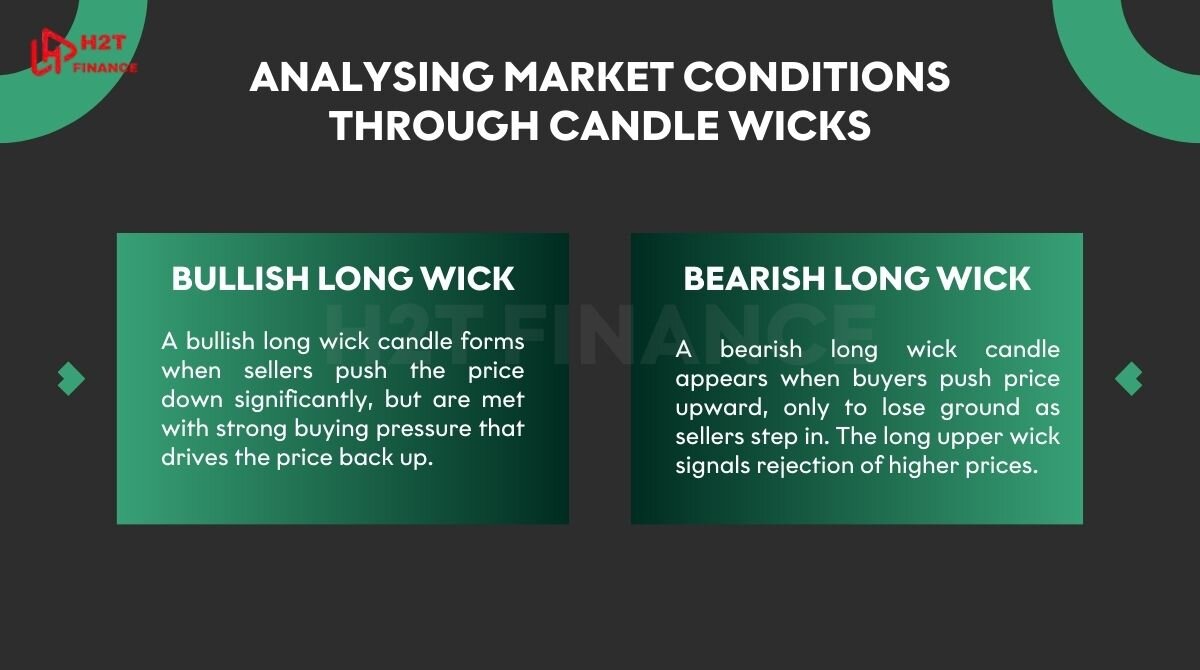
A bullish long wick candle forms when sellers push the price down significantly, but are met with strong buying pressure that drives the price back up. The long lower wick is clear evidence that the selling attempt was rejected, demonstrating that buyers regained control by the end of the session.
We have observed this scenario multiple times in live markets. During a strong downtrend, the price may move sharply lower into a key support zone and then form a long wick candlestick.
This pattern often precedes a significant bounce as buying pressure overwhelms selling momentum. This is a strong signal that the market has found a potential value area, offering an opportunity for traders who wait for confirmation to plan a strategic entry, especially when aligning with tools like a support and resistance indicator.
2.2. Bearish long wick (long upper shadow)
A bearish long wick candle appears when buyers push price upward, only to lose ground as sellers step in. The long upper wick signals rejection of higher prices.
For example, in an uptrend, we’ve noticed how a strong rally into resistance sometimes ends with a candle that has a long upper wick. This can be a warning that bullish momentum is fading and that sellers are starting to dominate — a reminder of why traders often check forex currency trading hours and liquidity conditions before acting. If traders ignore this sign, they risk getting caught in what we call a bull trap.
2.3. Repetition and placement
The power of a long wick grows when it repeats in the same area. A cluster of long upper wicks near resistance suggests heavy selling pressure. Likewise, repeated long lower wicks near support reflect strong buying interest.
Placement also matters. A single long wick in the middle of a quiet range may not mean much, but the same wick forming at a major level can carry real weight. These repeating patterns remind us that the market often tests trader patience before choosing direction.
2.4. Combination with candle bodies
The relationship between wick and body tells another part of the story. A long wick with a small body often means indecision, where both sides fought but neither won clearly. In contrast, a large body with a long wick shows strong movement but also strong rejection.
We’ve experienced moments where a candle looked bullish at first because of its big green body, but the long upper wick at the top warned us that sellers were still active. Without paying attention to that detail, it would have been easy to enter too early and watch the trade turn against us.
By learning to read long upper wick and long lower wick patterns, traders gain a clearer view of market psychology. Each wick reveals not only where price went but also where it was firmly rejected.
The key is to consider repetition, placement, and body size together, because these factors show whether the wick is a genuine signal or a simple fluctuation. In the end, wicks are less about perfection and more about context; they help us sense when strength is shifting and when traps might be waiting.
3. How to recognize long wick candlesticks
Spotting a long wick candlestick is relatively straightforward, but interpreting it correctly requires practice. A common mistake is to enter a trade based solely on this candlestick pattern without considering other factors. A key principle of long wick candle trading is that recognition must always be combined with market context analysis.
3.1. Bullish long wick
A bullish long wick candlestick usually forms after a strong downward move. Sellers push the price aggressively lower, yet buyers step in and lift it back near the open before the candle closes. The long lower wick shows that bearish momentum was rejected.
For instance, during one of our past trades in crypto, price slid quickly toward a key support. On the chart, a candle printed with a long lower wick stretching far below its body. That rejection was followed by several green candles, confirming a shift in sentiment. Without waiting for that confirmation, entering too early could have been dangerous, but with patience, the bullish reversal became clear.
3.2. Bearish long wick
A bearish long wick candlestick often forms after an uptrend. Buyers push prices higher, but sellers regain control before the close, leaving behind a long upper wick. This shows that bullish energy has faded and sellers are taking over.
We’ve seen this play out on forex charts many times. Imagine EUR/USD pushing through resistance with strong momentum. Suddenly, a candle forms with a long upper wick while closing near its open. Within the next few sessions, price slides down, proving that the wick was not just noise it was a warning that buyers had lost control.
Recognizing long wick candlesticks is about more than just spotting a tall shadow on the chart. It is about understanding the story of rejection buyers or sellers who tried to push price too far, only to be stopped.
Bullish long wicks highlight buyer strength after heavy selling, while bearish long wicks reveal seller dominance after a failed rally. The key is to remember that no single candle guarantees a reversal; confirmation and context are what turn recognition into reliable insight.
4. Popular candlestick patterns with long wicks
Long wick candles often appear as part of well-known patterns. These setups are familiar to most traders because they reveal strong rejection and possible turning points. Yet, we know from experience that the meaning of each pattern depends on its context. Let’s look at the most common ones.
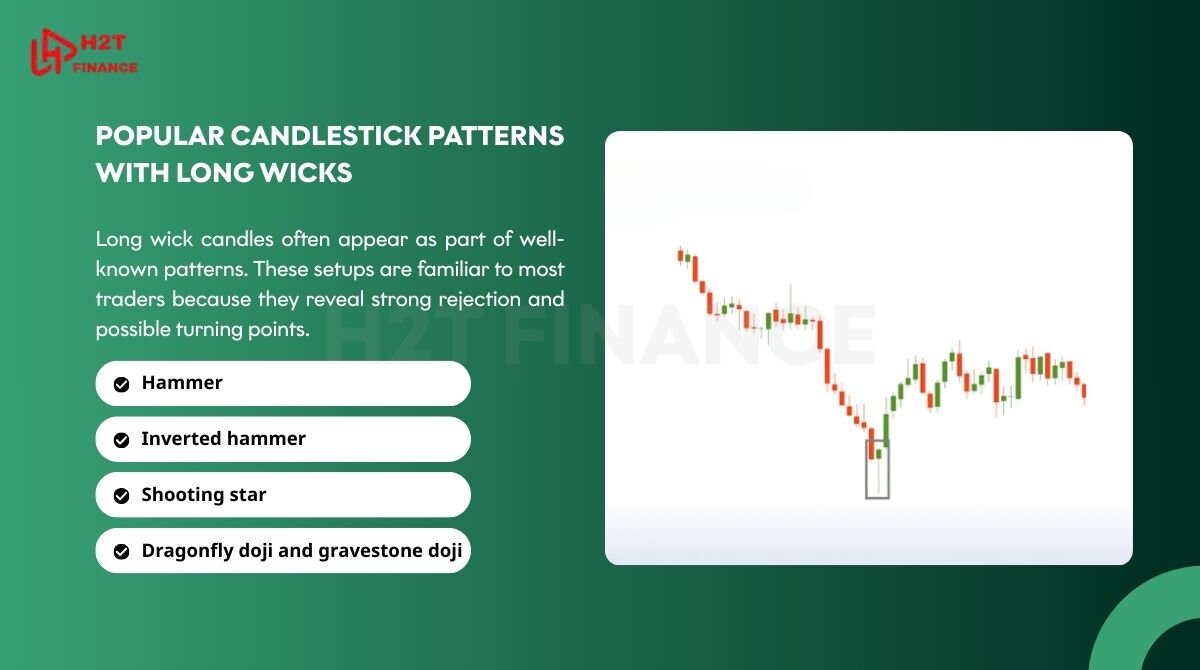
4.1. Hammer
The hammer is a bullish reversal signal with a small body and a long lower wick. It shows that sellers pushed the price down sharply, but buyers stepped in and pulled it back before the close.
We remember spotting a hammer on a daily chart during a market sell-off. Many traders panicked, but that single candle marked the bottom of the move and triggered a rally.
4.2. Inverted hammer
The inverted hammer looks similar to a shooting star, but its meaning is different. It forms after a downtrend, with a small body and a long upper wick. Sellers try to push lower, but buyers fight back and test higher levels. Without confirmation, it can be misleading, but with follow-up bullish candles, it signals a potential reversal upward.
4.3. Shooting star
The shooting star is the mirror of the hammer but appears at the top of an uptrend. Its long upper wick reflects failed bullish attempts. We have seen shooting stars at resistance zones turn into sharp corrections. For traders who ignore them, it can feel like walking into a bear trap.
4.4. Dragonfly doji and gravestone doji
Doji candles with long wicks tell stories of indecision. A dragonfly doji shows rejection of lower prices, while a gravestone doji signals rejection of higher levels. Both patterns reveal fierce battles between buyers and sellers.
On one occasion, a gravestone doji formed right at a key supply zone we had marked. That single wick saved us from chasing a breakout that quickly failed.
Quick comparison table
| Pattern | Wick direction | Typical signal | Market bias |
|---|---|---|---|
| Hammer | Long lower | Bullish reversal | Buyers regain |
| Inverted hammer | Long upper | Potential reversal | Buyers testing |
| Shooting star | Long upper | Bearish reversal | Sellers regain |
| Dragonfly doji | Long lower | Bullish rejection | Buyers defend |
| Gravestone doji | Long upper | Bearish rejection | Sellers defend |
Popular candlestick patterns with long wicks can act like signposts in the market. A hammer may show the end of a sell-off, while a shooting star can expose fading momentum at a peak. Dojis with long wicks highlight indecision and warn of possible traps.
For us, these patterns have often been moments where patience paid off waiting for confirmation instead of reacting too quickly made the difference between catching a genuine move and falling into noise.
5. How to trade long wicks on candlesticks
Recognizing a long wick candle is only half the journey; the real challenge is learning how to trade it without being shaken out too early. Many beginners spot the wick and jump in right away, only to watch the market reverse again. From our own experience, trading long wick candlesticks works best when combined with clear entry rules, patient stop placement, and realistic profit targets.
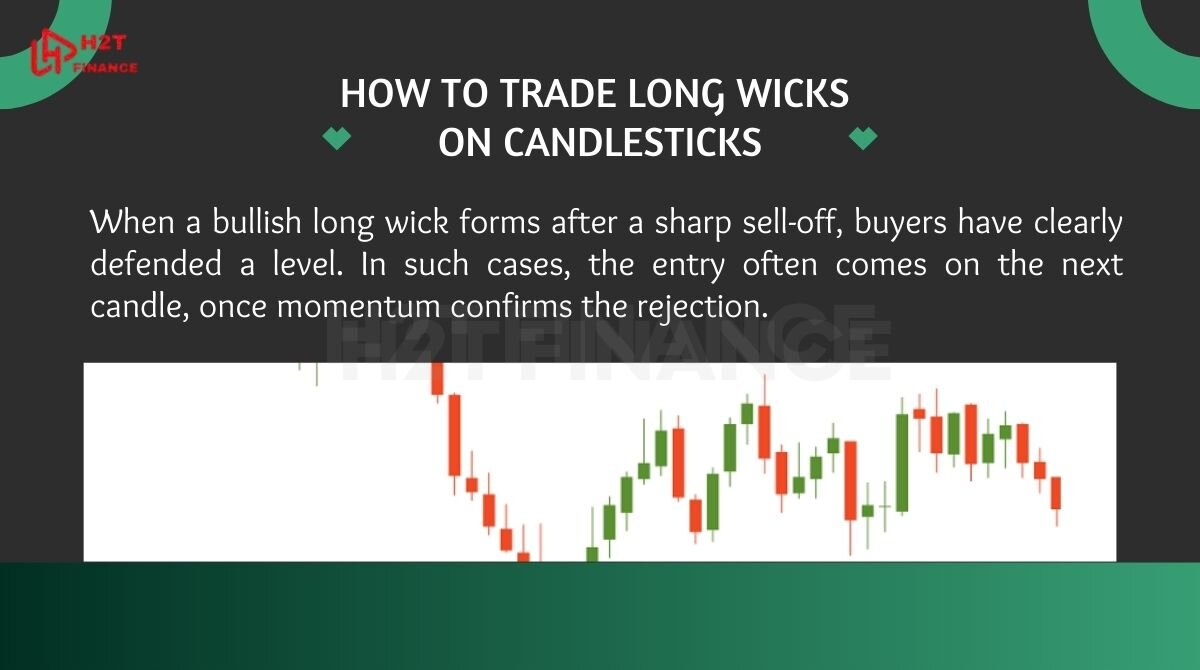
When a bullish long wick forms after a sharp sell-off, buyers have clearly defended a level. In such cases, the entry often comes on the next candle, once momentum confirms the rejection.
Stop Loss is usually placed just below the wick, giving enough room to avoid being knocked out by minor fluctuations. This concept is closely related to setting orders such as a stop limit order
in forex trading. If the candle is bearish with a long upper wick, the same logic applies but in the opposite direction entry comes after sellers confirm control, with stops placed just above the wick.
Take Profit targets should be aligned with the nearest support or resistance zone rather than picked randomly. In bullish setups, resistance acts as a natural ceiling where profits can be locked in. In bearish setups, support becomes the floor where buyers might step back in. We’ve seen trades fail simply because targets were set too close or too far; balance is everything.
One of the key lessons we’ve learned is not to ignore context. A long wick inside a strong trend may only be a pause, not a reversal. But at key levels, with volume to back it up, that same wick can be the start of a meaningful move. Patience waiting for the candle to close and for confirmation often makes the difference between success and frustration.
6. When is the best time to trade long wick candles
Spotting a long wick on a candlestick can feel exciting, almost like discovering a hidden clue in the market. But jumping in right away is often a mistake. We’ve seen traders rush their entries, only to watch the candle flip against them minutes later. The truth is that timing matters as much as the pattern itself.
The best approach is to wait for confirmation. Technical indicators, oscillators, or simply the closing of the next candle can give proof that the rejection is real. For day traders, short time frames such as 5 or 15 minutes allow quick opportunities to catch small swings. Knowing exactly what time does the forex market open or using a forex market time zone converter can further improve timing.
On the other hand, intraday or swing traders often prefer longer frames like 1-hour or 4-hour charts because these setups filter out noise and provide stronger signals.
From our own practice, one of the safest ways to train the eye is to use a demo account. Watching dozens of long wick scenarios play out in real time builds confidence without risking capital.
Only after becoming comfortable with these setups did we gradually move on to trading live with small positions. This patience saved us from emotional mistakes and helped us respect the unpredictability of long wicks.
7. Limitations of forex long wick strategy
Long wick candlesticks can be powerful signals, but they are far from perfect. We’ve learned over time that relying on them blindly often leads to frustration. Below are the most common limitations that every trader new or experienced should keep in mind:
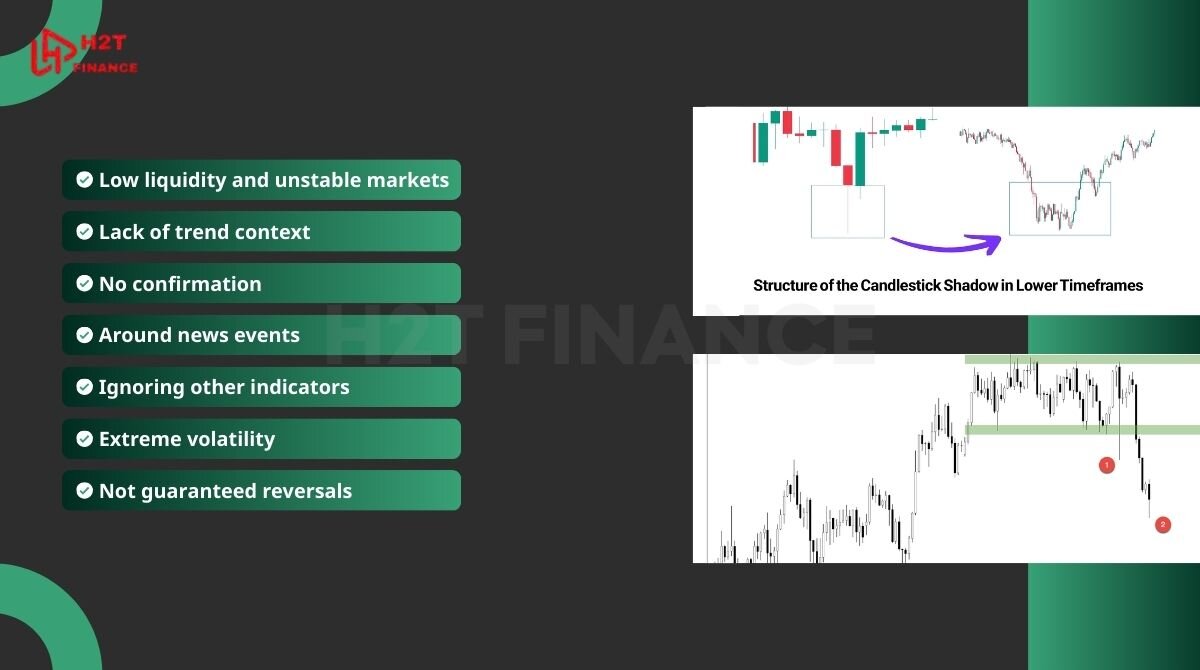
- Low liquidity and unstable markets: In thinly traded assets or during quiet sessions, a single large order can create long wicks that have little meaning.
- Lack of trend context: A wick in the middle of a sideways market rarely tells you much. Wicks work best when they appear after a clear trend.
- No confirmation: Entering a trade based on one wick alone is risky. Waiting for the next candle or volume confirmation can prevent costly mistakes.
- Around news events: Major announcements often spark extreme reactions. Wicks that form in these moments can be misleading and reverse quickly.
- Ignoring other indicators: Long wick candlestick analysis should not replace broader technical tools. If other signals disagree, caution is needed.
- Extreme volatility: In highly volatile markets, wicks appear in both directions, making it hard to separate real rejection from random noise.
- Not guaranteed reversals: A wick shows rejection, not certainty. Strong trends can continue despite the presence of long upper or long lower wicks.
Long wick candles are valuable, but they are not magic. They tell a story of rejection, yet the ending of that story depends on context, confirmation, and the bigger market picture. We’ve seen traders succeed by treating wicks as one piece of evidence, not the whole case. For beginners, the most important lesson is patience: learn to respect their limits and never assume that one candle alone can decide the market’s direction.
8. Developing a long wick candlestick trading strategy
Building a trading strategy around long wick candlesticks means combining clear technical analysis with disciplined risk management. Many traders focus on spotting the wick but forget that it’s only part of the bigger picture.
From our own trading journey, we’ve found that the real edge comes when these candles are placed within context and supported by careful planning.
8.1. Technical analysis
The first step is to distinguish long wick candles from ordinary ones. Their shadows must be clearly longer than the body, signaling rejection. But identification is not enough; we must confirm the pattern within the broader trend.
Looking at support and resistance zones can turn a simple wick into a powerful clue. For example, a bullish long wick forming at strong support has far more meaning than the same candle floating in the middle of a range. Volume can also strengthen the case, showing whether the rejection came from genuine market participation or just a brief spike.
We have seen situations where traders rushed into trades after a wick appeared, ignoring the overall market structure. More often than not, those trades ended in frustration. Reading the wick together with the trend, nearby levels, and momentum is what separates noise from opportunity.
8.2. Risk management
Even the best analysis means little without protection. A long wick can suggest reversal, but there are no guarantees. This is why Stop Loss and Take Profit orders are critical. Stops should be placed beyond the wick’s extreme to allow for natural fluctuations, while targets should align with realistic support or resistance levels.
Managing position size is equally important. Trading too large after spotting a wick often leads to emotional mistakes. We’ve learned to start small, add only after confirmation, and accept that not every setup will work out. By respecting risk, even failed trades become lessons rather than disasters.
Developing a strategy around long wick candlesticks is about blending recognition with discipline. Technical analysis shows us where rejection occurs, while risk management ensures that no single trade can wipe us out. Over time, this combination builds confidence. For beginners, the lesson is clear: a wick can be an opportunity, but only when paired with patience, context, and a plan that respects both profit and loss.
Read more:
9. FAQs about long wicks
9.1. Is a long wick always a reversal signal?
No. A long wick shows rejection, but not every rejection turns into a reversal. In strong trends, long wicks may only reflect temporary hesitation before the trend continues. We’ve seen traders lose money by assuming “one wick = trend change.” Context and confirmation are always needed.
9.2. Can long wicks be used for scalping?
Yes, many scalpers look for long wick candlestick setups on short time frames like 5 or 15 minutes. The idea is to catch quick rejections for fast entries and exits. But in our experience, scalping with wicks demands strict discipline because false signals appear often.
9.3. Are long wicks on the 1-minute chart reliable?
Usually not. On ultra-short frames, long wicks are often just noise caused by sudden small orders or low liquidity. We recommend beginners avoid relying on 1-minute wicks, as they can create more confusion than clarity.
9.4. What if a candlestick has two long wicks?
A candle with both long upper and lower wicks, often seen in spinning tops or dojis, signals indecision. Buyers and sellers both tested extremes but neither held control. Traders should wait for the next candle to confirm direction.
9.5. What does a long wick on a candle mean?
It means price tested a level but was firmly rejected. For example, a long lower wick shows sellers pushed down but buyers came back strongly, while a long upper wick means buyers pushed up but sellers shut them down.
9.6. What is the significance of a candlestick with a long upper wick?
It often reflects selling pressure. In an uptrend, it can warn that buyers are losing momentum. We’ve seen long upper wick candlesticks at resistance zones act as clear signals that sellers were waiting to strike.
9.7. What does a long tail on a candlestick mean?
“Tail” and “wick” are often used interchangeably. A long tail highlights strong rejection, either bullish or bearish, depending on whether it forms above or below the body.
9.8. Are long wicks bullish or bearish?
They can be either. A long lower wick tends to be bullish, showing buyers stepping in. A long upper wick is more bearish, pointing to rejection of higher prices.
9.9. How long is “long enough”?
There’s no fixed number, but most traders look for wicks at least twice the size of the body. What matters more is how the wick interacts with support, resistance, and the current trend.
10. Conclusion
Long wick candlesticks are one of the clearest signs of price rejection. A long upper wick often reflects fading bullish power, while a long lower wick highlights buyers stepping back in. Yet on their own, they are not enough. Context, support and resistance levels, and confirmation from other signals are what turn these wicks into reliable trading tools.
Our advice is simple: practice first. Use demo accounts to spot long wick setups, test different time frames, and build confidence without risking real money. Over time, you’ll learn when a wick is a true opportunity and when it is only noise.
If you want to take the next step, explore more strategies in our Forex Strategies category at H2T Finance. You’ll also find practical guides, comparisons, and insights that can help you sharpen your skills. Understanding long wicks on candlesticks is just the beginning. What matters most is how you apply them with patience and discipline in live trading.