In forex trading, the colors on your chart actually tell a story. Understanding the japanese candlestick colors meaning is one of the first skills that helps you make better trading decisions. It's like a quick signal that tells you who's winning the market at a glance: the buyers or the sellers.
Japanese candlestick charts, with their vivid green and red hues, are more than just visual tools they’re a window into market psychology, helping beginners decode price action with confidence. Whether you’re new to trading or brushing up on the basics, understanding the meaning behind these colorful candles is your first step toward mastering technical analysis.
My goal in this guide is to break down candlestick colors in a way that's easy to understand and immediately actionable. Instead of just theory, we'll look at how these time-tested tools can genuinely change the way you look at a chart.
Key takeaways:
- Japanese candlestick charts use colors (typically green/white for bullish and red/black for bearish) to show who controls the market.
- The structure of each candlestick—its body and wicks—reveals open, close, high, and low prices for a chosen time frame.
- Pros include clear visualization and pattern recognition, while cons include subjectivity and the risk of over-reliance.
- Green/white candles signal buyers’ strength, red/black show sellers’ control, and color consistency varies by trading platform.
- Observing sequences of same-colored candles helps traders spot momentum and potential reversals.
- Beginners should stick with standard green/red colors until they’re confident in chart reading.
- Combining candlestick colors with patterns like engulfing, doji, or hammer enhances analysis accuracy.
- Customizing colors on platforms (MT4, MT5, TradingView) is possible, but checking settings is essential to avoid confusion.
- Practicing with demo accounts and using multiple timeframes helps traders strengthen their candlestick-reading skills.
1. What is a Japanese candlestick? (Japanese candlestick explained)
Before diving deeper into the japanese candlestick colors meaning, it’s important to first understand what a Japanese candlestick actually is. For many new forex traders, the candlestick chart may look complex at first glance, but once you know how to read it, the information becomes clear and actionable.
1.1. A brief history of Japanese candlesticks
The origin of Japanese candlestick charts dates back to the 18th century in Japan. A rice trader named Homma Munehisa is credited with developing this visual charting method to track market psychology and price fluctuations in the rice market.
Over time, this technique was adopted and refined by traders worldwide, eventually becoming a staple in modern financial markets, especially in forex exchange trading.
1.2. Basic structure of a candlestick
A single Japanese candlestick provides four key pieces of price information within a specific time period (such as 1 minute, 1 hour, or 1 day):
- Open: The price at which the trading period started.
- Close: The price at which the trading period ended.
- High: The highest price reached during the period.
- Low: The lowest price reached during the period.
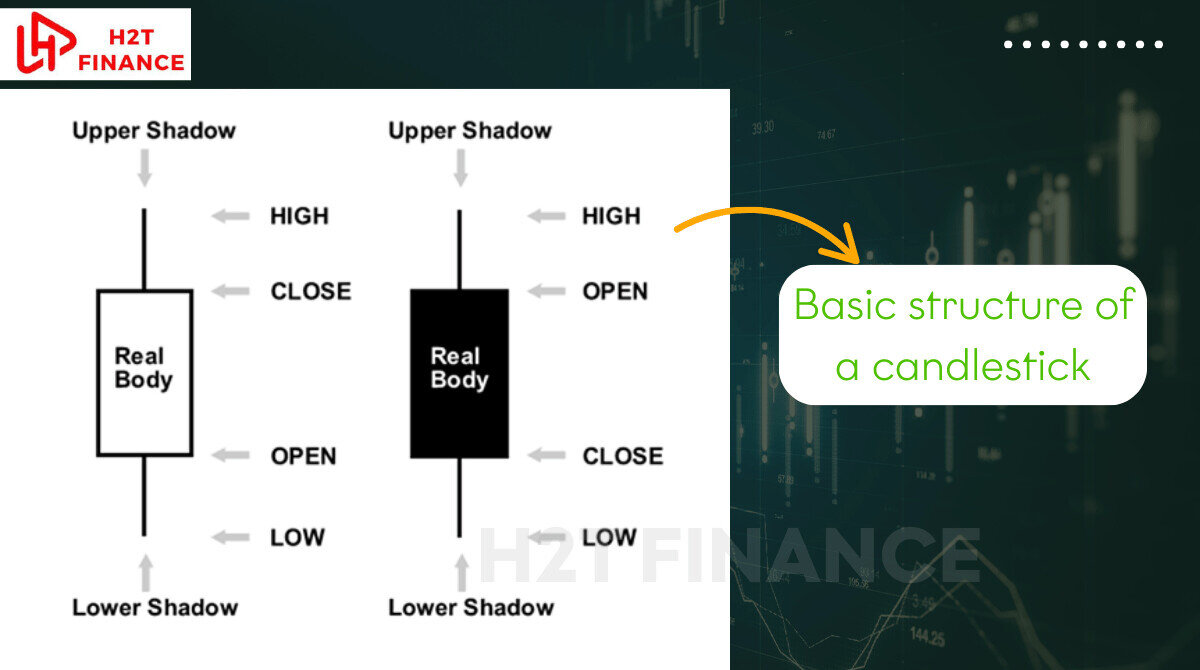
This data is visually represented in two main parts of the candlestick:
- The body: This is the thick part of the candle, showing the range between the opening and closing prices. The color of the body gives insight into whether the market was bullish or bearish during that period.
- The shadows (or wicks): These are the thin lines above and below the body, indicating the high and low prices for the time frame.
Understanding this structure is essential when learning how to read Japanese candlestick charts effectively. The body and the shadows together offer a snapshot of market behavior during any given period.
1.3. Japanese candlestick vs bar chart vs line chart
For beginners, it’s useful to know how Japanese candlestick charts compare to other chart types:
| Chart Type | Visual Representation | Information Provided |
|---|---|---|
| Line Chart | Single continuous line | Only closing prices over time |
| Bar Chart | Vertical bars with small horizontal ticks | Open, high, low, close prices (OHLC) |
| Candlestick Chart | Color-coded candles with body and wicks | Open, high, low, close + market sentiment (bullish/bearish) |
Among these, Japanese candlesticks offer the most visually intuitive way for traders to assess both price levels and market sentiment at a glance.
By mastering the basics of Japanese candlestick structure, you’ll be better prepared to interpret the meaning behind candlestick colors.
2. Pros and cons of japanese candlestick colors meaning
Japanese candlesticks are an incredibly useful tool, but they aren't magic. It’s crucial to know what they're great at and, more importantly, what pitfalls you need to watch out for. Understanding both sides will make you a smarter trader.
Pros of Japanese Candlesticks:
- Visual Clarity: The color-coded bodies and wicks make it easy to identify market sentiment and price movements at a glance, ideal for beginners and experienced traders alike.
- Rich Information: Each candlestick provides four key data points (open, close, high, low), offering a comprehensive view of price action within a specific timeframe.
- Pattern Recognition: Candlesticks form recognizable patterns (e.g., doji, engulfing) that help predict potential market reversals or continuations.
- Versatility: Applicable across various markets (forex, stocks, commodities) and timeframes, from 1-minute charts to daily or weekly charts.
- Market Psychology Insight: The combination of body and wick shapes reflects buyer and seller behavior, helping traders understand market dynamics.
Cons of Japanese Candlesticks:
- Learning Curve: For beginners, interpreting candlestick patterns and their implications can be overwhelming without practice.
- Subjectivity: Some patterns are open to interpretation, and false signals can occur, especially in volatile markets.
- Limited Context: A single candlestick or pattern may not provide enough information without considering broader market trends or indicators.
- Platform Variability: Differences in color settings across platforms can cause confusion if not standardized.
- Over-Reliance Risk: Focusing solely on candlesticks without combining them with other technical tools may lead to incomplete analysis.
By weighing these pros and cons, traders can better integrate candlestick charts into a balanced trading strategy, combining them with other indicators for more robust decision-making.
3. Japanese candlestick colors meaning: bullish vs bearish candles
Now that you understand the basic structure of a Japanese candlestick, it’s time to focus on the core topic: the Japanese candlestick colors meaning. For beginners in forex trading, these colors serve as an instant visual indicator of market sentiment during any given time frame.
3.1. How color reflects price movement
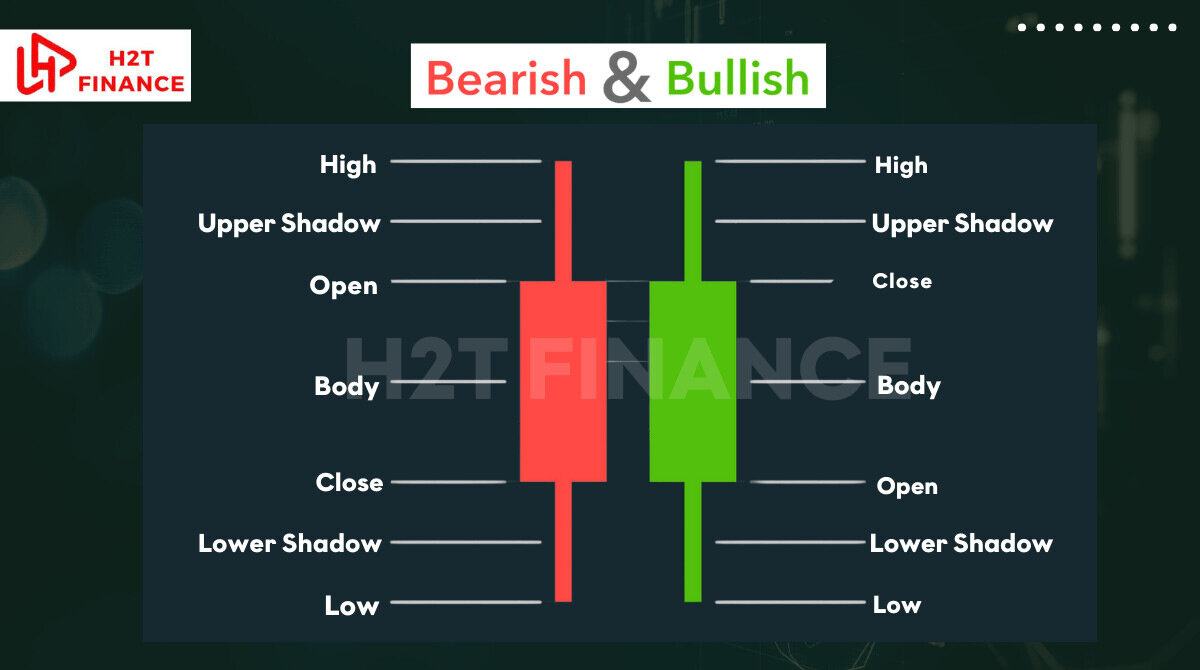
The primary function of candlestick colors is to show whether the closing price was higher or lower than the opening price for that period. In other words, colors help traders quickly identify if the market was bullish (buyers dominated) or bearish (sellers dominated).
3.2. Green or white candlesticks: bullish sentiment
When a candlestick is green or white, it indicates a bullish price movement. This means the closing price was higher than the opening price for that time frame.
Key characteristics of bullish candles:
- Open price: Lower level of the body
- Close price: Upper level of the body
- Market sentiment: Buyers were in control
- Common color settings:
- MT4 default: Green
- Traditional charts: White
Visual example suggestion:
A green candlestick with a solid body and upper/lower shadows showing the price range.
When I'm guiding new traders, I find they often get overwhelmed. So, my first piece of advice is always this: start by just focusing on the green (bullish) candles. It's the simplest way for you to start spotting upward momentum in the market.
3.3. Red or black candlesticks: bearish sentiment
In contrast, a red or black candlestick represents a bearish price movement. This means the closing price was lower than the opening price, signaling that sellers had more control during that period.
Key characteristics of bearish candles:
- Open price: Upper level of the body
- Close price: Lower level of the body
- Market sentiment: Sellers dominated
- Common color settings:
- MT4 default: Red
- Traditional charts: Black
Visual example suggestion:
A red candlestick with visible wicks above and below, illustrating price volatility.
3.4. Color variations across trading platforms
It’s important to note that candlestick colors are often customizable, depending on the trading platform you use. For example:
| Platform | Bullish Candle | Bearish Candle |
|---|---|---|
| MT4/MT5 | Green | Red |
| TradingView | Default Green | Default Red |
| Traditional charts | White | Black |
If you’re using platforms like MT4, MT5, or TradingView, always check your chart settings to confirm your color scheme. This avoids confusion, especially when analyzing historical price data or switching between platforms.
3.5. Japanese candlestick colors meaning: White and yellow together
Some trading platforms or custom chart settings may use white and yellow as alternative colors for candlesticks, which can confuse beginners. Here’s a clear explanation of what Japanese candlestick white and yellow colors mean when used together:
- White Candlesticks: Traditionally, white represents bullish sentiment, equivalent to green on modern platforms. It indicates the closing price was higher than the opening price, showing buyer dominance.
- Yellow Candlesticks: Yellow is less common but may be used as a customizable option for either bullish or bearish candles, often for visual clarity on dark chart backgrounds. For example, some traders set yellow for bullish candles to stand out against a black chart background, while others might use it for bearish candles to differentiate from red.
- When Used Together: If a platform uses both white and yellow, it’s typically a custom setup where white represents bullish candles and yellow represents bearish candles (or vice versa). The key is to check the platform’s settings to confirm which color corresponds to bullish or bearish sentiment.
Why This Happens: White and yellow are sometimes chosen for aesthetic reasons or to improve readability on specific chart themes. For instance, yellow may be more visible than red on a dark background, and white may replace green for a cleaner look.
Practical Tip: To avoid confusion, always verify your platform’s color settings under chart properties. If you see white and yellow candles, consult the platform’s documentation or settings to confirm their meaning. For consistency, beginners should stick to standard green (bullish) and red (bearish) settings until comfortable with chart analysis.
3.6. Quick tip for beginners
If you’re just getting started, stick to the standard green and red color scheme until you become comfortable with interpreting market movements. Once you gain more experience, you can customize your chart colors to suit your personal trading style.
4. How candlestick colors help traders read market sentiment
After understanding the basic Japanese candlestick colors meaning, the next step is to learn how these colors help traders interpret market sentiment. For many beginners, color is the first and most immediate signal when scanning a forex chart.
4.1. Why color cues matter in trading decisions
Candlestick colors provide an instant visual cue about market direction within a specific time frame. By simply looking at the color of the most recent candles, traders can get a sense of whether buyers or sellers are dominating the market.
For example:
- A series of green or white candles: Suggests growing bullish momentum, indicating that buyers have been pushing prices higher over consecutive periods.
- A series of red or black candles: Signals bearish momentum, showing that sellers are exerting pressure and driving prices down.
This is especially useful for day traders and scalpers who rely on quick decision-making.
4.2. How traders use color patterns to identify market momentum
Colors don’t just tell you what happened in one candle; they help you identify short-term trends. Recognizing a sequence of same-colored candles can help traders spot potential continuations or reversals in market direction.
Common observations:
- Bullish runs: Multiple green candles forming consecutively suggest strong upward pressure.
- Bearish trends: A cluster of red candles signals sustained selling pressure.
- Color transitions: A sudden shift from green to red, or vice versa, may indicate a possible market reversal or increased volatility.
Honestly, you don't need to try and memorize every complex pattern right away. The most practical starting point for technical analysis is simply observing the flow of colors. A string of green candles means upward momentum. Getting that down first makes learning the complex patterns much easier later on.
4.3. Combining color with candlestick patterns for deeper analysis
While color offers a quick overview, experienced traders often combine color interpretation with specific candlestick patterns for more accurate market analysis. For instance:
- A single green candle after a downtrend could signal a reversal if it forms a hammer pattern.
- A red candle appearing after multiple green candles might hint at a weakening bullish trend.
Understanding how color fits within the broader context of price action helps beginners make more informed trading decisions.
5. Japanese candlestick colors and common trading platforms
Now that you have a clear understanding of the Japanese candlestick colors meaning and how they help reflect market sentiment, it’s important to know how these colors appear across different forex trading platforms. Depending on the software you use, candlestick colors may vary slightly, and beginners should be aware of these differences to avoid confusion.
5.1. Default color settings on popular platforms
Most modern forex trading platforms allow you to customize candlestick colors to suit your preferences. However, there are some default color settings that are widely used across the industry.
Here’s a quick comparison of default candlestick colors on popular platforms:
| Platform | Bullish Candle Color | Bearish Candle Color |
|---|---|---|
| MT4 (MetaTrader 4) | Green | Red |
| MT5 (MetaTrader 5) | Green | Red |
| TradingView | Green (Default, but customizable) | Red (Default, but customizable) |
| Traditional charts | White | Black |
For beginners exploring Japanese candlestick charts for the first time, these are the color schemes you’re most likely to encounter.
5.2. How to customize candlestick colors
As you progress in your trading journey, you may want to personalize your chart colors for better visibility or personal preference. Most platforms like MT4, MT5, and TradingView offer simple settings to adjust candlestick colors.
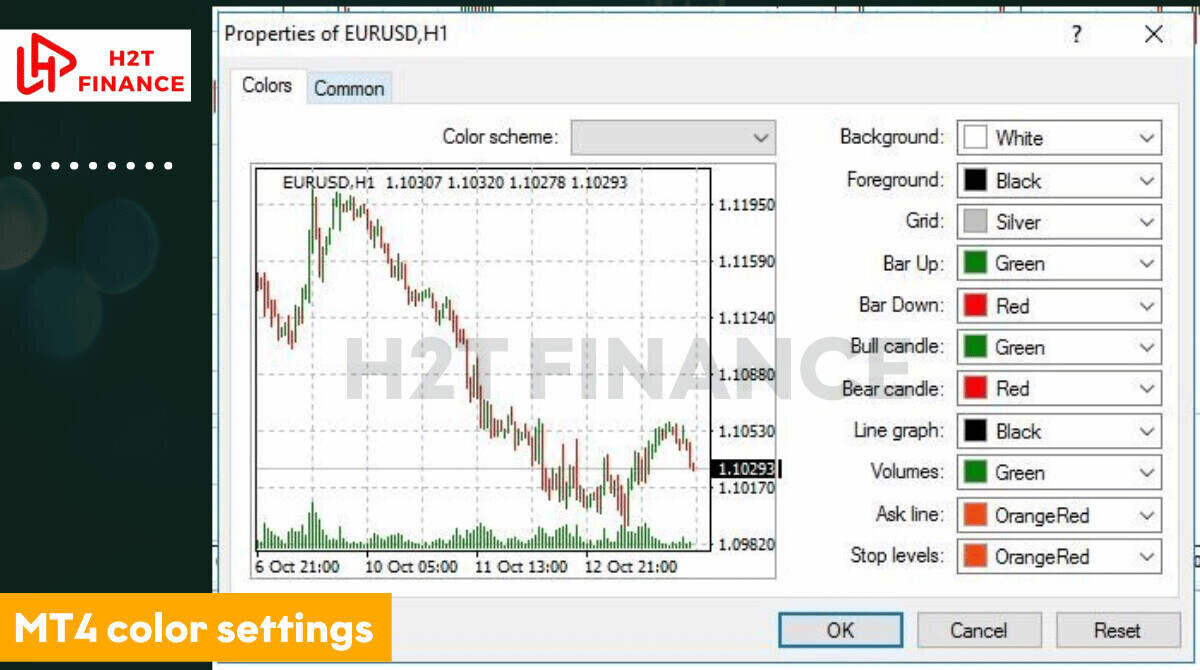
Quick customization steps (example for MT4):
- Right-click on the chart and select “Properties”.
- Go to the “Colors” tab.
- Change the Bull candle and Bear candle colors according to your preference.
- Click OK to save the changes.
Tip from experience: I often suggest beginners stick to standard green and red colors until they’re fully comfortable reading charts. This reduces the chance of misinterpreting price movements.
5.3. Why checking your color settings matters
By staying consistent with your preferred color scheme, you’ll reduce errors and build confidence in reading Japanese candlestick charts effectively.
6. How to read Japanese Candlesticks
Learning how to read Japanese candlesticks is a fundamental skill for any forex trader. Beyond just understanding colors, reading candlesticks involves analyzing their shape, size, and position within a chart to gain insights into market behavior. This section provides a beginner-friendly guide to mastering this skill.
6.1. Step-by-step approach to reading candlesticks
So, how do you actually read a candlestick in practice? Instead of a rigid process, think of it as a quick mental checklist you run through for each new candle:
- Identify the color: Determine if the candle is bullish (green/white) or bearish (red/black) to understand the market sentiment for that period.
- Analyze the body size: A large body indicates strong momentum (buyers or sellers), while a small body suggests indecision or weak price movement.
- Examine the wicks: Long wicks show price rejection or volatility, while short wicks suggest stable price action within the period.
- Consider the timeframe: A candle on a 1-minute chart reflects short-term sentiment, while a daily chart candle shows broader market trends.
- Look at the context: Analyze the candle’s position relative to previous candles. Is it part of a trend, or does it signal a potential reversal?
By combining these elements, you can extract meaningful insights from each candlestick.
6.2. Key elements to focus on
When reading candlesticks, pay attention to these critical components:
- Body Length: A long bullish body indicates strong buying pressure, while a long bearish body shows intense selling pressure.
- Wick Length: Long upper wicks suggest sellers pushed prices down from a high, while long lower wicks indicate buyers defended a price level.
- Position in Trend: A bullish candle after a downtrend may signal a reversal, while one in an uptrend suggests continuation.
- Doji Candles: When the open and close prices are very close (forming a small body), it signals market indecision and potential reversals.
6.3. Practical tips for beginners
- Start with Simple Patterns: Focus on basic patterns like doji, hammer, or engulfing before tackling complex formations.
- Use Multiple Timeframes: Compare candlesticks across different timeframes (e.g., 1-hour and daily) to confirm trends or reversals.
- Practice with Demo Accounts: Use platforms like MT4 or TradingView to analyze real-time charts without risking capital.
- Combine with Indicators: Pair candlestick analysis with tools like moving averages or RSI to validate signals.
By practicing these steps, beginners can build confidence in reading candlestick charts and making informed trading decisions.
7. Examples of how color combines with candlestick patterns
Understanding the Japanese candlestick colors meaning is just the first step. In real-world trading, colors don’t work in isolation they interact with the overall shape and sequence of candlesticks to form recognizable patterns. These patterns help traders predict potential market movements with greater confidence.
7.1. Why color matters in candlestick patterns
When analyzing candlestick patterns, the color of each candle plays a crucial role in defining the pattern type and its market implication. The combination of bullish and bearish candles over a series of periods can indicate whether a trend may continue or reverse.
For beginners looking for a full Japanese candlestick explained approach, recognizing how colors fit within patterns is key to improving technical analysis skills.
7.2. Common candlestick patterns based on color sequences
Here are some popular candlestick patterns where color plays a defining role:
- Bullish engulfing pattern (red → green): A small bearish (red) candle followed by a larger bullish (green) candle that completely engulfs the previous body. This often signals a potential reversal to the upside.
- Bearish engulfing pattern (green → red): A small bullish (green) candle followed by a larger bearish (red) candle, signaling a possible bearish reversal.
- Three white soldiers (three consecutive green candles): This pattern appears after a downtrend and consists of three strong bullish candles in a row, suggesting strong buying pressure.
- Three black crows (three consecutive red candles): Found after an uptrend, this pattern shows three large bearish candles, often indicating increasing selling pressure.
- Morning star (red → small-bodied candle → green): A three-candle reversal pattern where the market transitions from bearish to bullish.
- Evening star (green → small-bodied candle → red): The opposite of the morning star, signaling a potential shift from bullish to bearish sentiment.
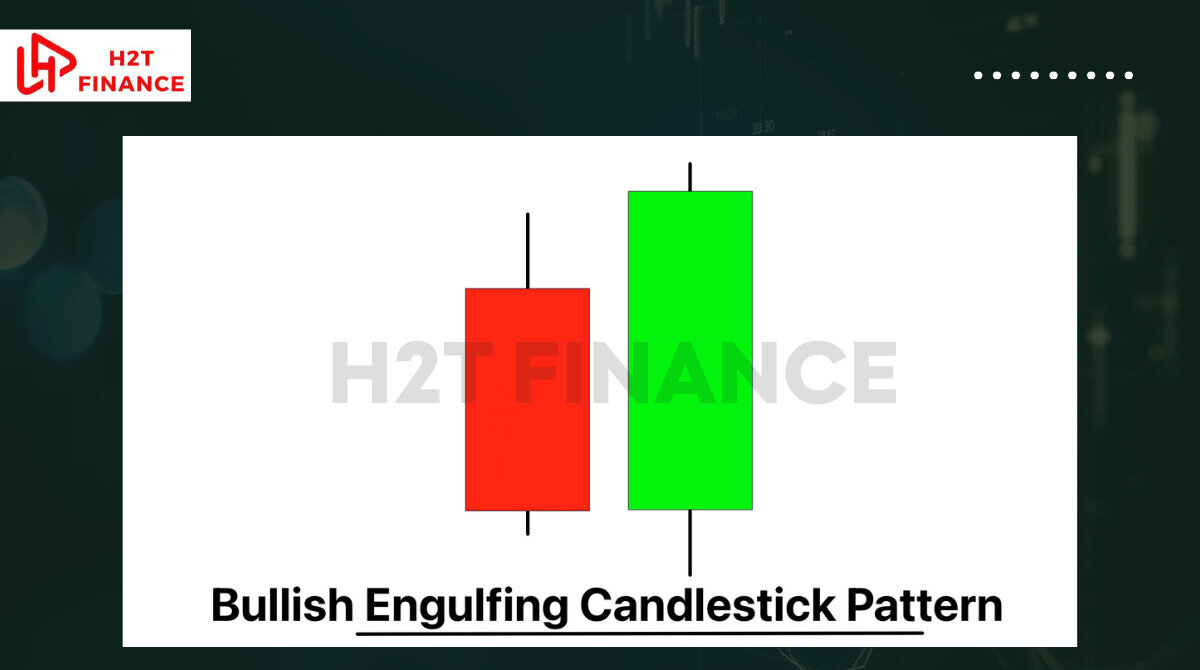
7.3. Visualizing patterns: color + shape
While color highlights market sentiment, the size of the candle body and the length of the shadows also provide critical information. For example:
- A long green candle with minimal wicks suggests strong buying pressure.
- A red doji (where open and close are nearly equal) could indicate market indecision, even if the candle is bearish.
As I’ve observed while helping new traders, learning to combine color with candlestick shapes and patterns is one of the fastest ways to improve chart reading skills.
Explore more trading insights:
- MT4 MT5 trading software forex ratings & strategy guide
- Flag and pennant patterns in trading: A complete guide
- CME What Does It Stand For? Quick Guide for Traders
8. FAQs about Japanese candlestick colors (related questions)
To wrap up your understanding of Japanese candlestick colors meaning, let’s address some of the most frequently asked questions beginners often have when learning about candlestick charts. These quick answers will help reinforce key concepts and clarify any remaining doubts.
8.1. What do the colors of candlesticks mean?
In Japanese candlestick charts, the color of a candle’s body shows the relationship between the opening and closing price for a specific period.
- Green or white candles: Indicate bullish market sentiment where the closing price is higher than the opening price.
- Red or black candles: Indicate bearish sentiment where the closing price is lower than the opening price.
This simple color distinction helps traders quickly assess whether buyers or sellers dominated the market during that time.
8.2. How to interpret Japanese candlesticks?
Interpreting Japanese candlesticks goes beyond just looking at color. To get a full picture of market sentiment, traders consider:
- The color (bullish vs bearish).
- The size of the body (strength of price movement).
- The length of the shadows/wicks (price rejection or volatility).
- The position of the candle within a trend (continuation or reversal signals).
A single candlestick provides insight, but analyzing multiple candles together offers a more reliable market perspective.
8.3. What do white and yellow candlestick colors mean in Japanese candlestick charts?
Ever seen japanese candlestick white and yellow colors and wondered what’s going on? Don’t worry, it’s just a custom setting some traders prefer for better visibility on different chart backgrounds.
While green is the modern standard for bullish candles, some platforms use white (reflecting traditional chart styles) or yellow (for enhanced visibility on dark backgrounds).
Regardless of whether a bullish candle appears white, yellow, or green, the meaning stays the same: The closing price was higher than the opening price, signaling bullish market sentiment.
Always double-check your chart settings to confirm how your platform displays candlestick colors.
8.4. What is the 3 candle rule?
The "3 candle rule" refers to using three consecutive candlesticks to confirm a potential market trend or reversal. For example:
- Three green candles in a row: Often signals strong bullish momentum.
- Three red candles in a row: May indicate sustained bearish pressure.
Some traders wait for this 3-candle confirmation before entering a trade to reduce the risk of false signals.
8.5. What is the most powerful candlestick?
There’s no single “most powerful” candlestick that fits all market conditions, but some patterns are widely recognized for their reliability, especially when combined with strong color signals. Popular examples include:
- Doji: Signals indecision and potential reversal.
- Engulfing patterns (bullish or bearish): Indicate strong trend reversal possibilities.
- Hammer and inverted hammer: Common reversal signals after a downtrend.
Understanding these patterns in combination with Japanese candlestick colors meaning helps traders make more informed decisions.
8.6. What are the colors of Japanese candlesticks?
The most common colors are green or white for bullish candles and red or black for bearish candles. Some platforms also allow custom colors such as yellow for better visibility.
8.7. Is 3 green candles bullish?
Yes. Three consecutive green candles often indicate strong bullish momentum, commonly referred to as the “Three White Soldiers” pattern. This suggests buyers are in control and prices may continue rising.
8.8. How to interpret Japanese candlesticks?
To interpret candlesticks, focus on the color (bullish vs bearish), body size (strength of momentum), wick length (price rejection or volatility), and context in the trend (continuation or reversal). Looking at multiple candles together gives a clearer market picture.
8.9. What do the different candlestick colors mean?
- Green/White: Closing price is higher than the opening, showing bullish sentiment.
- Red/Black: Closing price is lower than the opening, showing bearish sentiment.
- Other colors (e.g., yellow): Custom settings chosen by traders or platforms, but meaning remains the same depending on bullish or bearish setup.
9. Final tips for beginners on reading candlestick colors
To wrap this up, remember this: Understanding the japanese candlestick colors meaning is your foundation. The real key, however, isn't just looking at one candle in isolation. It's about how you combine its color, size, and position with its neighbors to read the story the market is telling.
Here are some essential tips to guide you:
- Look beyond color alone: A green or red candle tells part of the story, but always consider the timeframe and trading volume to confirm trends.
- Study patterns in context: Pair candlestick colors with patterns like engulfing or doji to spot reversals or continuations more accurately.
- Practice with real charts: Dive into the Forex Basics section on H2T Finance to analyze live price movements and test your skills.
- Keep learning: Explore advanced candlestick patterns and market indicators to deepen your understanding of price action.
By blending these insights with consistent practice, you’ll build a foundational skill for your trading career.


