Ever feel overwhelmed staring at a Streak chart that looks like a complex language of numbers and colors? You're not alone. Many traders are asking the exact same question: how to use super trend up arrow in Streak effectively to make their decisions with more confidence.
This simple arrow, often green, is not just a symbol it represents a buy signal built from one of the most widely trusted indicators. If used correctly, it can transform a confusing market into a roadmap where entries and exits stand out.
But the familiar questions always pop up: Is this super trend up arrow truly reliable? What are the best settings? Should I use it on shorter or longer timeframes? These are the exact concerns we're here to tackle.
Key takeaways:
- The SuperTrend indicator simplifies market chaos by turning volatility into clear buy (green arrow) and sell (red arrow) signals.
- Inside Streak, the indicator integrates smoothly, making it easy to plot and customize without coding.
- Optimal use depends on fine-tuning ATR period and multiplier settings and choosing the right timeframe for your trading style.
- With the strategy builder, traders can automate rules for entries, stop loss, targets, and trailing stops removing guesswork.
- Advanced strategies include multi-timeframe confirmation, combining with RSI or moving averages, and basket trading across multiple assets.
- Common challenges like false signals and platform limitations can be managed with filters, backtests, and disciplined adjustments.
- Ultimately, mastering how to use super trend up arrow in Streak provides clarity, reduces emotional trading, and builds confidence in both trending and volatile markets.
1. What is SuperTrend indicator and how it works?
The SuperTrend is not just another technical line on your chart. Introduced in 2009, it quickly earned respect because it simplifies what often feels like chaos in the markets. Instead of juggling multiple moving averages or second-guessing your entry, this indicator transforms raw volatility into a clean signal.
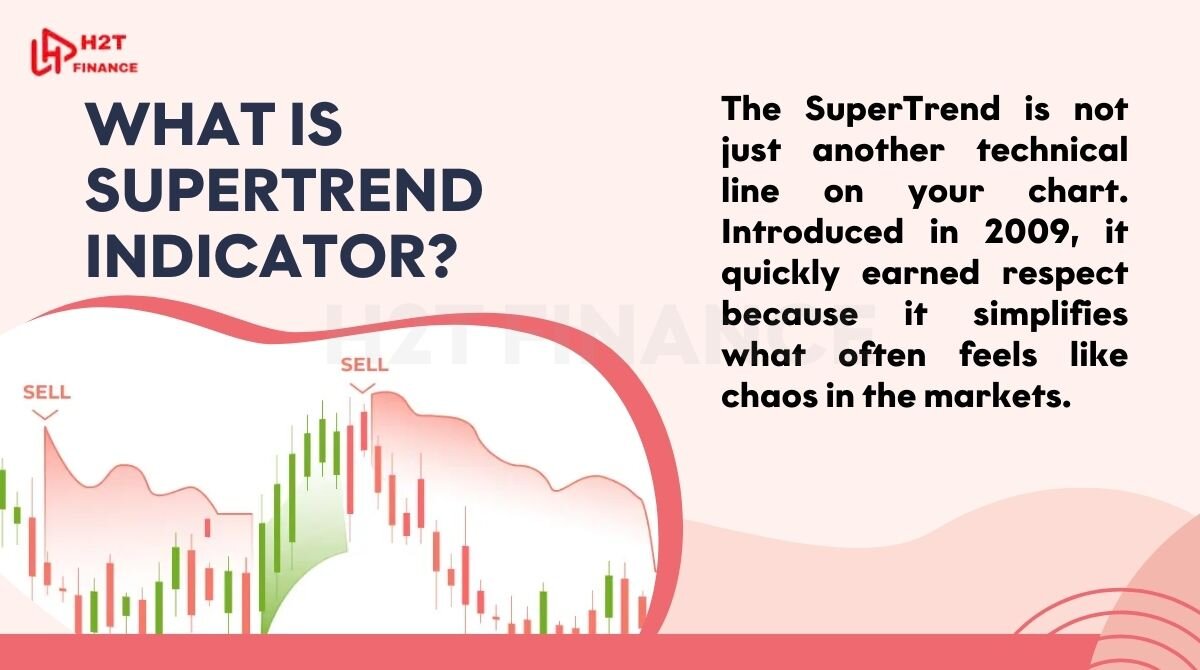
In Streak, that simplicity becomes even more powerful since it is built right into the platform, giving traders instant recognition without endless adjustments.
At its core, the SuperTrend is driven by the Average True Range (ATR). This measure of volatility sets the distance between the price and the indicator line. When the line flips below price and turns green, you see a clear up arrow Streak’s way of telling you that bullish momentum is likely taking control.
On the other hand, when the line flips above price and becomes red, a down arrow warns you of potential weakness. For traders stuck in "analysis paralysis," these arrows act as a clear confirmation, giving you the green light to act decisively.
What makes the SuperTrend especially popular in the Streak ecosystem is its balance of clarity and adaptability. It removes the noise that often leads to emotional mistakes and gives traders a framework they can trust.
At the same time, the ATR and multiplier settings can be tuned to fit different trading styles, from quick scalps to patient swings. This mix of flexibility and direct visual cues explains why so many rely on it every day.
Key highlights of the SuperTrend in Streak:
- Built on ATR, making it responsive to market volatility.
- Green arrows mark possible buy signals, red arrows warn of sell pressure.
- Integrated into Streak for quick, hassle-free strategy building.
- Popular because it offers clarity, adaptability, and emotional discipline.
In short, the SuperTrend acts as both a guide and a filter. It gives traders the confidence to follow trends with discipline while avoiding the clutter of overly complex indicators.
2. How to use super trend up arrow in Streak platform?
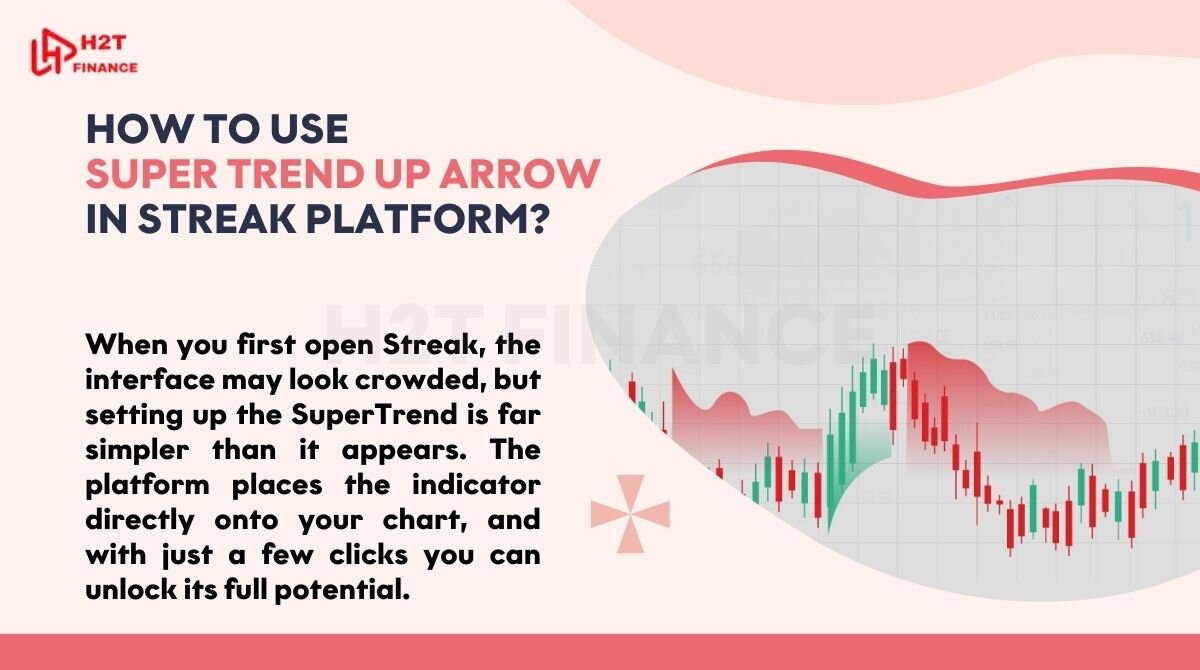
When you first open Streak, the interface may look crowded, but setting up the SuperTrend is far simpler than it appears. The platform places the indicator directly onto your chart, and with just a few clicks you can unlock its full potential. What matters most is not just plotting the line, but fine-tuning the parameters so the signals align with your trading style.
The process usually starts with the navigation panel. Inside the indicator section, type “SuperTrend” and apply it to your chosen asset. Instantly, you will see the familiar green and red line wrapping around the price. The real value, however, comes from the arrows.
A green arrow appears when the indicator flips below the closing price, signaling bullish pressure. A red arrow does the opposite, warning of potential downside. These cues are not predictions, but they serve as a reliable guide for timing your entries and exits.
Alright, let's dive into the settings – this is where you truly make the indicator your own by configuring the ATR period and multiplier. By default, many traders keep the period at 7 and the multiplier at 3. This balance is popular because it filters out some of the market noise without being too slow to react.
Lowering the multiplier can flood your chart with signals often leading to frustration when false alerts pile up. Raising it too high, on the other hand, might make you miss good opportunities. The sweet spot often lies between 3 and 4, though the right setting also depends on the asset’s volatility and your personal risk tolerance.
Choosing the best timeframe is equally important. In fast-moving intraday charts, the SuperTrend can help scalp quick moves, but it may feel overwhelming with frequent flips. On longer timeframes, like 1-hour or daily charts, the signals become cleaner and more reliable.
Read more: When is the best time to trade forex? Full beginner guide
Many Streak users experiment with multiple timeframes to see which one provides the confidence they need. It is less about following a strict rule and more about finding the rhythm that fits your trading personality.
Ultimately, understanding how to use super trend up arrow in Streak goes beyond simply plotting an indicator. It's the art of blending a simple visual cue with disciplined settings to create a real edge.
Once the ATR and multiplier are adjusted to your comfort zone, and the right timeframe is chosen, those arrows stop being just markers on a chart; they become trusted guides that can turn hesitation into clarity.
3. Super trend trading strategies in Streak
Once you have the SuperTrend up and running on your Streak charts, the next step is transforming those green and red arrows into actionable strategies. This is where the strategy builder in Streak comes alive.
Instead of manually reacting to every signal, you can set clear entry and exit rules, letting the platform automate your plan with discipline. For many traders, this feels like turning uncertainty into structure, a huge relief in markets that often feel chaotic.
Inside the strategy builder, the first rule is usually the entry condition. The most common setup is: “Supertrend crosses below close.” This means that when price moves above the SuperTrend line and a green arrow appears, the system generates a buy entry.
It feels empowering because you are no longer guessing; you are following a predefined signal backed by volatility logic. On the flip side, for a short trade, the condition often flips to “Supertrend crosses above close.” This triggers a position when the red arrow signals weakness.
But strategies don’t end with entries. A strong system needs smart exits. In Streak, you can define stop loss levels to protect yourself from unexpected reversals. Target profits can be set so you lock in gains when the market gives you a clean move.
For those who want flexibility, trailing stops are available; these adjust dynamically as the trade moves in your favor, often turning a good trade into a great one by letting profits run while cutting downside risk.
Imagine a full example: you configure the SuperTrend with a period of 7 and a multiplier of 3. Your entry condition is “Supertrend crosses below close.” You add a stop loss of 2%, a target profit of 4%, and a trailing stop that activates once the trade is up by 1.5%.
Now, instead of staring nervously at the chart, you have a system that reacts instantly and consistently. Streak executes the plan without hesitation, removing the emotional rollercoaster that often sabotages good ideas.
So, what's the bottom line? SuperTrend provides the when, while the Streak strategy builder provides the how - how to manage risk and take profits. That combination is what turns good signals into profitable trades. Together, they turn random signals into a complete framework, one that can guide you through both trending rallies and sharp pullbacks with more confidence and less stress.
4. Advanced super trend strategies in Streak
Once you are comfortable with the basics, the real excitement begins with advanced SuperTrend strategies. These methods push the indicator beyond a single arrow and make it far more versatile. Many traders see this stage as moving from “following signals” to “designing systems.”
Key advanced approaches include:
- Multi-timeframe confirmation:
- Combine a short timeframe (like 5-minute) with a longer one (such as 1-hour).
- Smaller charts catch momentum bursts, while higher charts filter out noise.
- Acting only when both align reduces false trades and builds stronger conviction.
- Pairing SuperTrend with other indicators:
- RSI: take green arrows only when momentum supports strength.
- Moving Averages: use them as a broader trend filter.
- This combination feels like multiple signals agreeing, which increases confidence.
- Basket trading with SuperTrend signals:
- Apply SuperTrend across a basket of stocks, forex pairs, or indices in Streak.
- Spotting simultaneous green arrows across assets reveals waves of momentum.
- Diversification spreads opportunity and reduces reliance on a single chart.
See more information about Currency Pairs here.
Advanced SuperTrend strategies turn reactive trading into a proactive system. By combining multiple timeframes, layering other indicators, and scaling into baskets, traders create an adaptable framework that works across different markets and keeps them one step ahead.
5. Common SuperTrend issues and troubleshooting in Streak
Even though the SuperTrend indicator is loved for its simplicity, it is not flawless. Traders who rely solely on the arrows often face challenges that can be both frustrating and costly. The good news is that with awareness and small adjustments, most of these issues can be managed effectively inside Streak.
Here are the most common problems and how to deal with them:
False signals in sideways markets: In ranging conditions, the indicator flips repeatedly between green and red, creating misleading arrows. Acting on each one can quickly drain both your confidence and your capital.
Solution: Pair SuperTrend with filters like RSI or higher timeframe confirmation. This helps cut out market noise and reduces emotional stress from frequent whipsaws.
Platform limitations with alerts: Some traders expect real-time email alerts when the arrow changes color. Streak currently does not support external email notifications, which can feel restrictive.
Solution: Use custom conditions in the strategy builder to trigger in-app alerts instantly. While not perfect, this ensures you never miss a critical signal.
Over-reliance on default settings: Many traders stick with the standard ATR period and multiplier without testing. Jumping between extremes often leads to poor results.
Solution: Adjust your ATR and multiplier gradually, testing each variation with backtests before trusting it in live trades.
Treating SuperTrend as a “holy grail”: The indicator is powerful but not a crystal ball. Expecting it to predict every move leads to disappointment and risky decisions.
Solution: Use SuperTrend as a guide, not as a guarantee. The most successful traders combine it with patience, discipline, and solid risk management.
While SuperTrend in Streak can sometimes produce false arrows or run into platform restrictions, these are far from deal-breakers. With the right filters, careful parameter tuning, and disciplined execution, the indicator remains a strong ally—turning potential headaches into structured, confident trading decisions.
6. FAQs
6.1. How to use supertrend indicator in TradingView?
On TradingView, the SuperTrend can be added by opening the indicator tab and searching for “SuperTrend.” Once applied, the line will automatically appear above or below price action, changing color when trends shift.
Green lines (or up arrows, depending on the script) suggest potential buys, while red signals possible selling pressure. Many traders on TradingView also customize the ATR period and multiplier, just as they would in Streak, to balance responsiveness and accuracy.
6.2. Why doesn't my SuperTrend strategy match the chart signals?
This mismatch is usually due to parameter differences or candle closing rules. In Streak, conditions are calculated on the close of each candle, so if you expect an instant signal during the candle’s formation, it may look out of sync. Adjusting ATR values, multipliers, or checking if you are using the same timeframe on both chart and strategy can usually fix this issue.
6.3. How do I set up multiple SuperTrend conditions in one strategy?
Streak allows you to add several conditions in the strategy builder. For example, you can require both a short-term and a long-term SuperTrend to align before a trade is triggered. This reduces noise and creates stronger confirmation. By stacking these conditions, you give your strategy more structure and avoid rushing into weak trades.
6.4. What is the best timeframe for the SuperTrend indicator?
There is no universal best timeframe, it depends on your style. Day traders often prefer 5-minute or 15-minute charts for quick moves, while swing traders lean toward hourly or daily setups for cleaner signals. In general, longer timeframes generate fewer false signals, though they also provide fewer entries. Testing across multiple frames is the best way to discover what fits your rhythm.
6.5. How to use nth candle in Streak?
The nth candle feature in Streak lets you define conditions based on a specific candle within a sequence. For example, you might set a rule like “enter long on the 3rd candle after SuperTrend turns green.” This can be useful if you want to avoid jumping in immediately and instead wait for confirmation. It adds flexibility to strategies, giving traders more control over timing.
Read more:
7. Conclusion
Learning how to use super trend up arrow in Streak is not just about applying an indicator, it is about turning a simple visual cue into a disciplined system. From understanding how the arrows appear, to configuring ATR and multipliers, to building strategies that include stop loss and profit targets, the SuperTrend becomes a tool for clarity rather than confusion.
Advanced setups like multi-timeframe confirmation, indicator combinations, and basket trading further expand its value, making it suitable for traders at different stages of their journey.
Of course, no tool is flawless. False signals and platform limits exist, but with proper filters, backtesting, and best practices, the SuperTrend in Streak can offer structure where markets often seem chaotic. By mastering it, traders give themselves a chance to trade with more confidence and less hesitation.
At H2T Finance, we believe that knowledge-driven trading tools like SuperTrend help traders grow steadily rather than gamble blindly. If you want to explore more guides, check out our “Forex Strategies” section on the blog where practical insights meet clear explanations to support both beginners and experienced traders.