Have you ever opened a TradingView chart only to find it squeezed, making price movements nearly impossible to analyze? This common issue often stems from indicator horizontal lines (hlines) interfering with the autofit pricescale.
This article will guide you on exactly how to exclude hline from autofit pricescale on an indicator, a small skill that can completely transform your technical analysis experience by keeping your charts consistently clear and accurate.
Key takeaways:
- Understanding the Issue: Horizontal lines (hlines) from indicators like Fibonacci retracement or support/resistance can compress TradingView charts by stretching the autofit pricescale, making price action hard to analyze.
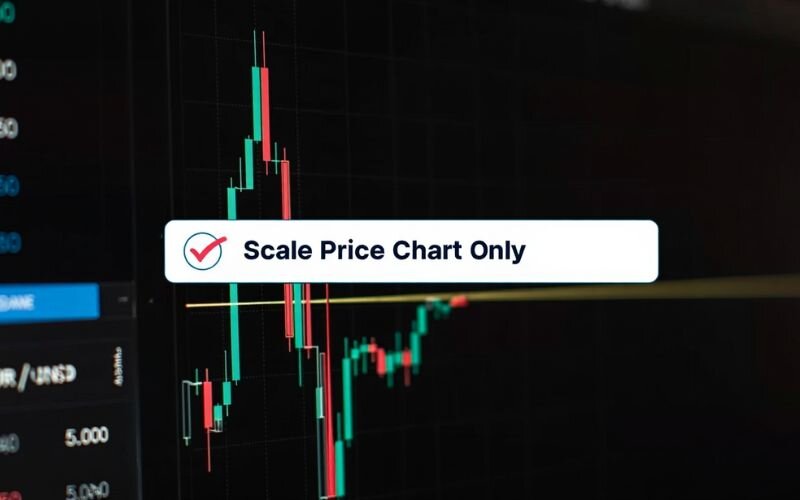
- Quick solution: Right-click the price scale (y-axis) and select “Scale price chart only” to exclude hlines from autofit, ensuring the chart focuses solely on price data.
- Alternative methods: Manually adjust the price scale, use a logarithmic scale for volatile markets, or tweak indicator settings to limit hline impact for better chart clarity.
- Why it matters: Clear charts are critical for forex trading, enabling precise technical analysis and better decision-making by avoiding distorted price views.
- Platform comparison: TradingView offers user-friendly chart customization compared to MT4/MT5, which lack a direct “Scale price chart only” option but excel in automated trading.
1. What is autofit pricescale and why hlines cause issues?
The autofit pricescale is a key feature in TradingView that automatically adjusts the y-axis (price scale) to display all visible data within the chart’s view. While this ensures no data is cut off, it can lead to problems when indicators with horizontal lines (hlines) are added. Understanding this feature and its challenges is crucial for effective chart customization.
The autofit pricescale dynamically scales the chart based on the highest and lowest values visible, including price data and indicator outputs. Hlines, often used in indicators like Fibonacci retracement or support/resistance levels, plot horizontal lines at specific price points.
When these lines are far from the current price say, an hline at 5000 while the market is hovering around 1500 the autofit pricescale stretches to include them. This ends up compressing the main price area and distorting your view of recent price action.
From what I’ve found through TradingView’s Help Center and community discussions, this compression significantly reduces chart readability. It makes it much harder to spot key trends or patterns, especially for traders who rely on clean visuals for technical analysis.
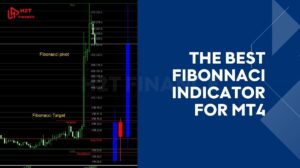
For example, imagine using a Fibonacci indicator with hlines at extreme levels. The chart may shrink, making candlestick patterns nearly invisible. This issue frustrates traders who rely on precise technical analysis. By learning to exclude hline from autofit pricescale, you can maintain a clear view of price movements, enhancing your decision-making.
2. Step-by-step guide: How to exclude hline from autofit pricescale on an indicator
When horizontal lines from an indicator squash your candlesticks and distort your TradingView chart, precise technical analysis becomes nearly impossible. It's a common frustration, but luckily, the fix is incredibly simple.
Here’s a step-by-step guide to tell TradingView to scale the chart based only on price action, ignoring indicator lines and giving you back a clean, focused view.
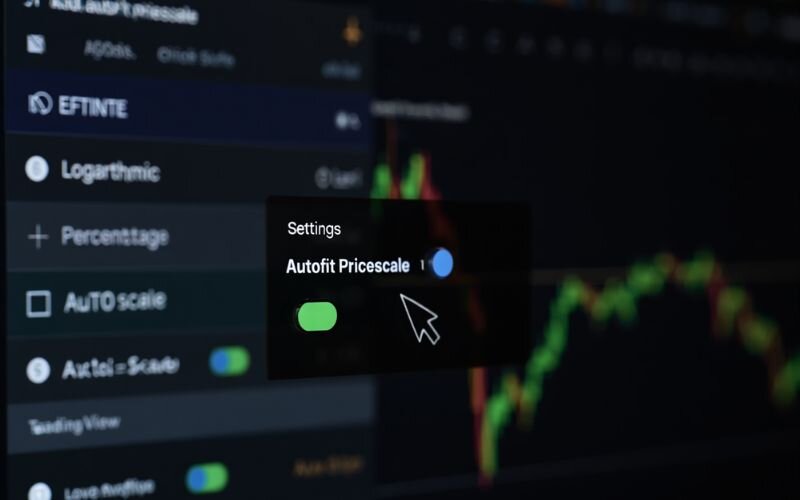
2.1. Step 1: Access the price scale
Start by locating the price scale (y-axis) on your TradingView chart, typically on the right or left side.
Right-click directly on this axis to open the context menu.
This menu contains various options to customize how the chart scales its price data.
Accessing the price scale is the first step to adjusting the autofit settings and ensuring indicators don’t distort your view.
2.2. Step 2: Select ‘Scale price chart only’
In the context menu, find and click on the option labeled “Scale price chart only.” This setting instructs TradingView to base its auto-scaling solely on the actual price data (the candlesticks), completely ignoring the lines from your indicators.
As noted in community solutions, this feature prevents indicator lines, like those from Fibonacci or support/resistance indicators, from stretching the chart.
2.3. Step 3: Verify the adjustment
After selecting “Scale price chart only,” check your chart to confirm the change. The price scale should now focus on the candlestick data, ignoring extreme hline values.
For instance, if your chart was previously compressed due to an hline at 5000 while prices ranged around 1500, the chart should now appear properly scaled, with candlesticks clearly visible. Compare the before and after views to ensure the adjustment worked.
2.4. Step 4: Additional tips for indicator management
To further refine your chart, consider these tips:
- Hide indicators temporarily: Click the eye icon next to an indicator in the chart’s legend to hide it without deleting it.
- Adjust indicator settings: Modify hline values in the indicator’s properties (e.g., limit Fibonacci levels to relevant price ranges).
- Note on Pine Script: As discussed on StackOverflow, Pine Script cannot directly disable autofit, so rely on the “Scale price chart only” option for now.
These tweaks help maintain a clean chart for technical analysis.
View more:
- What is stop limit price in Forex? Guide for beginners
- How to read currency exchange charts: Guide for beginners
- Is margin still used when in floating profit? Full guide
3. Alternative solutions to optimize price scale in TradingView
While the “Scale price chart only” option is a quick fix to exclude hline from autofit pricescale on an indicator, other methods can further enhance your TradingView chart’s readability.
These alternative solutions offer flexibility for forex traders who want to customize their charts for better technical analysis. Below, we explore practical approaches to optimize the price scale, ensuring your charts remain clear and functional.
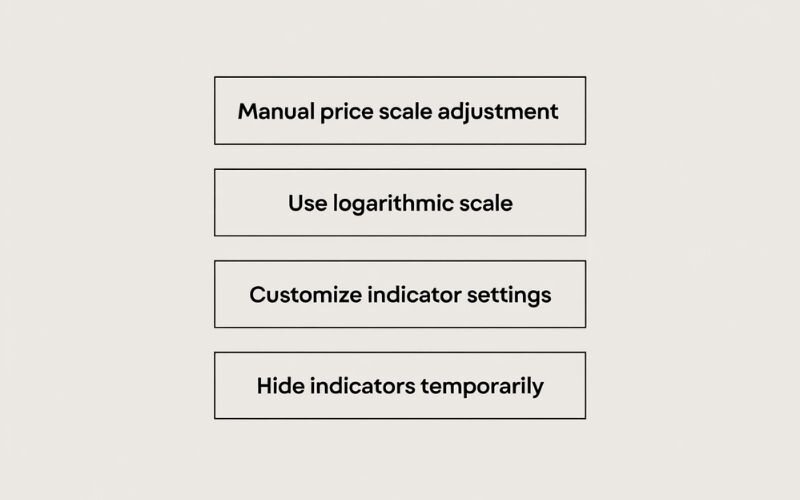
3.1. Manual price scale adjustment
Instead of relying on autofit, you can manually adjust the price scale for precise control. Click and drag the y-axis up or down to set a custom price range that focuses on the current price action. This method is ideal when you want to zoom in on specific price levels without indicator interference.
- Pros: Full control over the visible price range.
- Cons: Requires manual adjustments when price moves significantly.
3.2. Use logarithmic scale
For charts with large price swings, switching to a logarithmic scale can prevent compression. Right-click the price scale, select “Log scale” from the context menu, and the chart will adjust to show percentage changes rather than absolute values. This is particularly useful in volatile forex markets, like major pairs during news events.
When to use: Best for long-term charts or pairs with high volatility.
3.3. Customize indicator settings
Some indicators allow you to adjust hline values to align closer to current prices, reducing their impact on the autofit pricescale.
For example, in a Fibonacci retracement indicator, modify the settings to display only relevant levels (e.g., 38.2% and 61.8%) instead of extreme ones. Access the indicator’s properties by clicking its name and adjusting the levels in the settings panel.
Tip: Limit the number of hlines to those most relevant to your strategy.
3.4. Hide indicators temporarily
If an indicator’s hlines still cause issues, toggle its visibility off without removing it. Click the eye icon next to the indicator’s name in the chart’s legend. This temporarily removes the indicator’s data from the price scale calculation, allowing autofit to focus on price data.
4. Why this matters for forex trading
A clear and accurate chart is the backbone of successful forex trading, and knowing how to exclude hline from autofit pricescale on an indicator can significantly improve your technical analysis.
I understand that precise chart customization enhances your ability to make informed trading decisions. This section explains why optimizing your TradingView price scale settings is critical for forex traders aiming to refine their strategies.
Clear charts allow traders to focus on price action, whether they’re following trends, scalping, or identifying reversals. When hlines from indicators like Fibonacci retracement or pivot points compress the chart, key patterns such as candlestick formations or support/resistance zones become hard to read.
By excluding hlines, you ensure the chart scales to the actual price data, making trends and patterns more visible. This clarity is vital for strategies that rely on precise entry and exit points, such as day trading or swing trading.
Moreover, proper chart settings contribute to effective risk management. A distorted chart can lead to misinterpreting price levels, increasing the risk of poor trade decisions. According to Babypips, technical analysis is only as good as the tools you use.
Optimizing your TradingView chart ensures you base decisions on accurate data, aligning with your broader forex goals of minimizing risk and maximizing returns.
5. Comparing TradingView with MT4/MT5 for chart customization
Understanding how different platforms handle chart customization can help you choose the best tool for your forex trading needs. TradingView, MetaTrader 4 (MT4), and MetaTrader 5 (MT5) are popular platforms, each offering unique features for technical analysis.

This section compares their chart customization capabilities, focusing on solutions like excluding hlines from autofit pricescale on an indicator, to help you optimize your forex charts effectively.
TradingView stands out for its user-friendly interface and cloud-based accessibility. Its “Scale price chart only” feature, as outlined in TradingView’s Help Center, allows traders to exclude hline from autofit pricescale on an indicator with a single click, ensuring clear price visuals. It also offers extensive indicator libraries and customizable settings, making it ideal for visual chart analysis.
MT4 and MT5, while powerful for automated trading, have more limited chart customization options. Adjusting the price scale in MT4/MT5 often requires manual zooming or modifying indicator settings, as they lack a direct equivalent to TradingView’s “Scale price chart only” feature. However, MT4/MT5 excel in integrating with expert advisors (EAs) for algorithmic trading.
The table below summarizes key differences:
| Feature | TradingView | MT4/MT5 |
|---|---|---|
| Autofit pricescale | Yes, highly customizable | Limited, manual adjustments |
| Exclude indicator lines | Yes (“Scale price chart only”) | No direct option |
| Ease of use | High, intuitive interface | Medium, steeper learning curve |
| Indicator customization | Extensive, user-friendly | Robust but less flexible |
For forex traders prioritizing chart clarity and ease of customization, TradingView is often the preferred choice. Explore which platform aligns with your trading style to enhance your technical analysis.
6. Frequently asked questions
To deepen your understanding of how to exclude hline from autofit pricescale on an indicator, we’ve compiled answers to common questions traders ask about TradingView chart settings. These insights, drawn from sources like TradingView’s Help Center and StackOverflow, address key concerns to help you optimize your forex charts effectively.
6.1. What is the autofit pricescale in TradingView?
The autofit pricescale is a TradingView feature that automatically adjusts the y-axis to display all visible data, including price and indicator values. It ensures no data is cut off but can compress charts when indicators include extreme values, like hlines.
6.2. Why do hlines compress my TradingView chart?
Hlines, such as those in Fibonacci or support/resistance indicators, can plot at price levels far from current market prices. When included in the autofit calculation, they stretch the price scale, shrinking the chart and obscuring price action.
6.3. Can I exclude hlines using Pine Script?
No, Pine Script cannot directly disable the autofit pricescale. As confirmed in StackOverflow discussions, the way to do this is manually, by using the “Scale price chart only” option from the right-click menu.
6.4. How do I reset the price scale in TradingView?
To reset the price scale, double-click the y-axis or right-click and select “Reset chart” from the context menu. This restores the default scaling, which you can then adjust using “Scale price chart only.”
6.5. Does ‘Scale price chart only’ work for all indicators?
Yes, this option applies to all visible indicators, ensuring the price scale focuses solely on price data, regardless of the indicator type or number of hlines displayed.
See more articles in the same category:
- Forex Market Structure: Patterns, Tools & How to Read It
- Forex currency trading hours: What time does the forex market open?
7. Conclusion
Mastering how to exclude hline from autofit pricescale on an indicator is an essential skill to keep your technical analysis charts consistently clear and accurate.
Let's recap the key takeaways with H2T Finance:
- The core problem: Horizontal lines (hlines) from indicators that are far from the current price will squeeze your chart, making analysis difficult.
- The quickest fix: The most effective solution is to right-click the price axis and activate the “Scale price chart only” option.
- Alternative options: For more flexibility, you can also manually adjust the scale, use the Log Scale, or tweak settings directly within the indicator.
We believe that mastering small details like this makes a big difference in trading. To continue strengthening your foundation and learning more crucial knowledge, explore our Forex Basics blog section now.