We've all been there: you pour your heart into a trading strategy, backtest it against historical data, and the results look phenomenal. The profit curve soars, drawdowns are minimal – it feels like you've finally cracked the code. But then you take it live, and reality delivers a swift, brutal punch.
Those promising backtest results seem to vanish, and your account balance tells a different, often frustrating, story. What went wrong? It's a common dilemma in the world of algorithmic trading, and more often than not, the culprit hides in plain sight: the spread.
Many traders overlook this seemingly small detail in their simulations, leading to an overly optimistic, almost fictional, view of their strategy's true potential. If you're serious about developing robust trading systems that actually perform in real market conditions, understanding how to add spread into the strategy tester backtestingn isn't just an option it's an absolute necessity.
This guide will walk you through the essential steps and critical considerations to ensure your backtests reflect the actual costs and dynamics of the live market, helping you build a more reliable and profitable trading future.
1. Why your backtests are lying to you (And how spread fixes it)
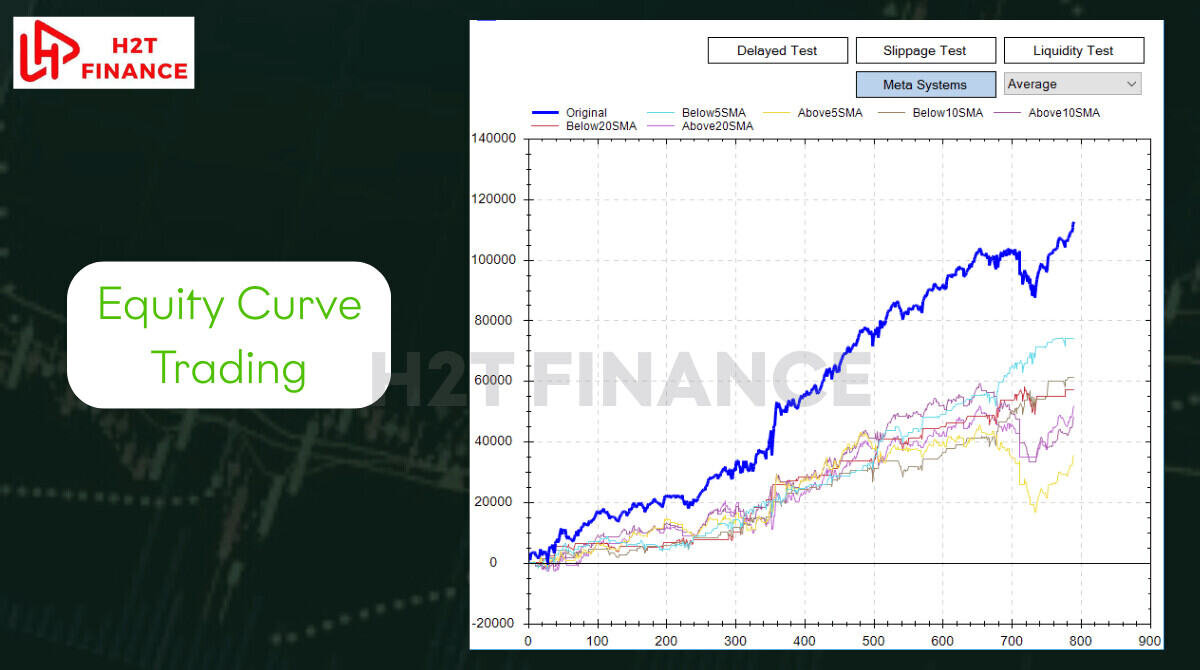
It’s an exciting moment when your trading strategy, meticulously crafted and refined, finally hits the backtesting phase. You run it through years of historical data, and the equity curve shoots upwards, painting a picture of consistent, effortless profits.
Many traders, especially those new to algorithmic trading, look at these simulations with immense satisfaction, believing they’ve just discovered their golden ticket. But here's a sobering truth: these "perfect" backtest results often fail spectacularly when exposed to the unpredictable realities of live market conditions.
The reason isn't usually a flaw in your core strategy logic, but rather an omission of the real-world costs of trading. Your backtest might be presenting an ideal, almost fictional, scenario that simply doesn't exist outside the simulator.
1.1. The illusion of perfect backtests
We rely on backtesting as a fundamental tool for evaluating a trading strategy's historical performance. It allows us to apply our rules to past market data, giving us a theoretical glimpse into how a strategy might have performed. This is incredibly valuable for identifying potential weaknesses, validating hypotheses, and fine-tuning parameters without risking real capital.
However, the power of backtesting comes with a significant caveat: its accuracy is directly tied to how well it replicates real market conditions. If your backtest ignores crucial elements present in live trading, the results become misleading.
Imagine building a financial model for a business without including operational expenses like rent or salaries; the projected profits would look fantastic on paper but would quickly crumble in reality.
Similarly, many trading strategies, especially those designed for high-frequency or scalping, look incredibly profitable in a pristine, cost-free backtest environment. The moment they encounter the true friction of the market, those seemingly robust profits evaporate. The discrepancy often boils down to a single, easily overlooked factor: the spread.
1.2. The silent killer of profits: Understanding spread
So, what exactly is this "silent killer" of backtest profits? It’s the spread, the most fundamental cost in Forex trading. Simply put, the spread is the difference between an asset's bid price (the price at which you can sell a currency pair) and its ask price (the price at which you can buy it).
When you place a market order, you're not trading at a single, theoretical market price. If you buy, you pay the higher ask price; if you sell, you get the lower bid price. The immediate difference between these two prices is the spread, and it's essentially the broker's commission or cost of facilitation for your trade.
Let's consider a quick example. If the EUR/USD currency pair is quoted with a bid price of 1.08500 and an ask price of 1.08512, the spread is 0.00012, or 1.2 pips. Every time you enter or exit a trade, you "pay" this spread.
This might seem negligible on a single trade, but for strategies that execute many trades or target small profits, these cumulative costs add up rapidly. A backtest that doesn't account for this cost is, quite frankly, presenting an overly optimistic and unreliable picture.
It's like evaluating a restaurant's profitability based solely on revenue without deducting the cost of ingredients or staff wages. The key insight here is profound: backtesting without factoring in the spread is akin to running a business without accounting for its operating expenses. The numbers will look great on paper, but the reality will be very different. This is why understanding how to add spread into the strategy tester backtesting is so vital.
1.3. Fixed vs. variable spreads: What you need to know
To truly replicate live market conditions in your backtests, you need to understand that not all spreads are created equal. Brokers typically offer two main types:
1.3.1. Fixed spreads
As the name suggests, these spreads are designed to remain constant regardless of market conditions. They offer predictability, which can be appealing for some traders. However, it's worth noting that while they are generally "fixed," brokers might still widen them during extreme volatility or major news events. Fixed spreads often come with a slightly higher initial cost compared to their variable counterparts.
1.3.2. Variable spreads
These spreads fluctuate constantly, widening during periods of low liquidity (like market rollovers or national holidays) or high volatility (during major economic news announcements) and narrowing when the market is calm and liquid.
While they can offer tighter spreads during quiet periods, they also introduce an element of unpredictability. I'll never forget getting burned by the GBPCAD pair. My strategy placed a trade in the middle of the night, and the spread ballooned to over 20 pips right during that illiquid New York close/Sydney open window (around 12-1 AM EST). What looked like a perfect setup turned into a painful loss, all because I underestimated the spread.
For accurate backtesting, especially if your strategy is sensitive to entry and exit prices, it's crucial to consider which type of spread your live broker uses and how that spread typically behaves.
Ignoring the dynamic nature of variable spreads can severely undermine the reliability of your backtest results, making the journey of how to add spread into the strategy tester backtesting a continuous learning process.
2. How to add spread into the strategy tester backtestingn on MT5
Now that we understand why factoring in spread is non-negotiable for accurate backtesting, let's dive into the "how." MetaTrader 5 (MT5) stands out as a powerful platform for strategy development, offering robust tools that go beyond what its predecessor, MT4, could provide, especially when it comes to simulating realistic market conditions.
If you're serious about your backtesting, MT5 is undeniably the platform of choice.
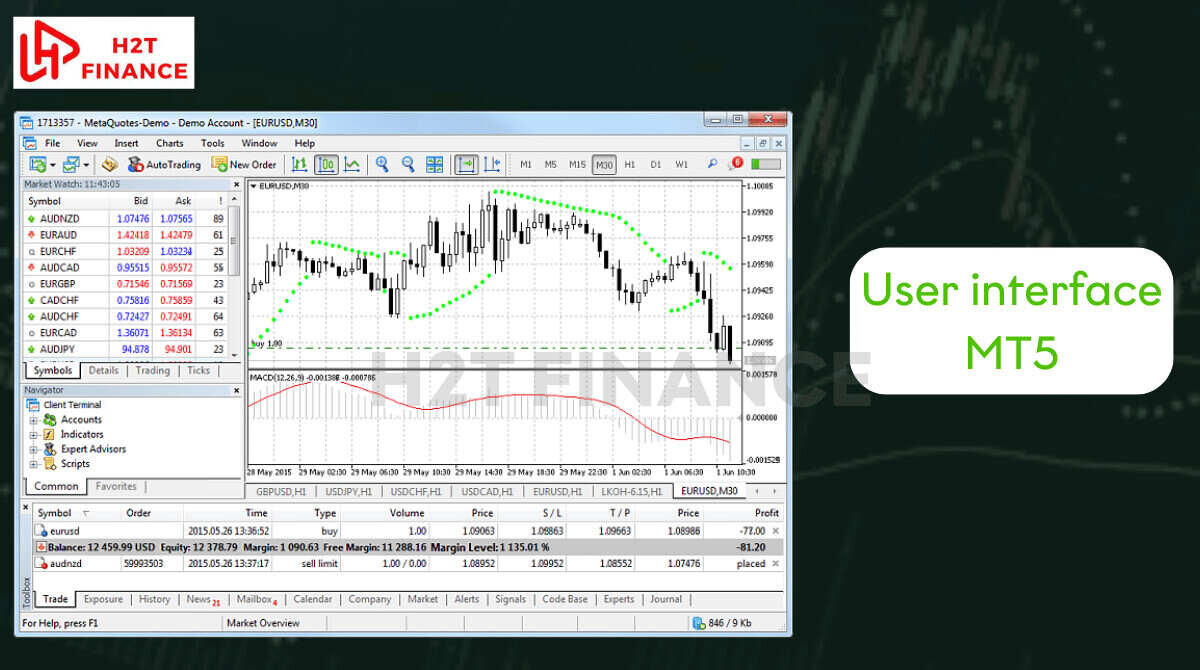
2.1. Navigating the MT5 strategy tester interface
Before we can fine-tune our backtest, we first need to get acquainted with the MT5 Strategy Tester itself. It's your personal simulation lab, allowing you to run your Expert Advisors (EAs) against historical data to see how they would have performed.
To access it, simply open your MT5 terminal. You can usually find the Strategy Tester by going to View -> Strategy Tester in the top menu, or by pressing Ctrl+R. Once open, you'll see a panel at the bottom or side of your MT5 window. Here, you'll select a few crucial parameters for your test:
- Expert advisor: Choose the EA you wish to test.
- Symbol: Select the currency pair or asset you're testing (e.g., EURUSD, XAUUSD).
- Timeframe: Pick the timeframe on which your EA operates (e.g., M15, H1, D1).
- Model: This is critical for accuracy. For anything serious, you'll want to select "Every tick based on real ticks" or "Every tick" if real tick data isn't available, as this provides the highest precision for price movement simulation.
- Date: Define the historical period for your backtest.
MT5's design allows for a much more nuanced simulation, particularly its ability to handle variable spreads, which is a significant leap forward from MT4's primarily fixed-spread backtesting capabilities.
2.2. Step-by-step guide: Incorporating fixed spread
While simulating variable spreads is the gold standard (which we'll cover next), sometimes a fixed spread backtest might be a starting point or appropriate if your broker genuinely offers a consistent fixed spread.
Here's how to add a fixed spread to your MT5 backtest:
- Open the strategy tester: As mentioned, launch the Strategy Tester (Ctrl+R).
- Configure initial settings: Select your EA, symbol, and timeframe.
- Locate the "Spread" option: In the Strategy Tester settings panel (often under the "Settings" tab or similar), you'll find a field labeled "Spread".
- Input a fixed value: Here, you'll manually enter a specific pip value. For example, if you want to test with a 2-pip spread, you would simply type "2" into this field.
- Start the backtest: Once set, click "Start" to run your backtest.
This method forces the Strategy Tester to simulate every trade with that exact spread applied. However, I've found that simply adding a fixed spread, while a step in the right direction, often doesn't fully capture the nuances of real market conditions, especially for highly volatile pairs or strategies that trade during specific, illiquid sessions.
Live spreads can widen and narrow, and a fixed value can still present an overly optimistic picture if not chosen carefully based on real-world averages.
2.3. The gold standard: Simulating variable spreads with tick data
For truly realistic backtest results, especially for high-frequency strategies or those operating on lower timeframes, simulating variable spreads is absolutely crucial. This is where MT5 shines, thanks to its ability to utilize high-quality tick data.
Tick data comprises every single bid and ask price change, providing the most granular representation of market movements, including actual spread fluctuations.
Here's how to achieve this gold standard:
- Understand why variable spread testing is crucial: Variable spreads are the norm in live Forex trading. They expand during low liquidity or high volatility and contract during calm periods. A strategy that looks robust with a fixed 2-pip spread might collapse when the real spread temporarily widens to 10 or 20 pips during a news event or market rollover.
- Acquire high-quality tick data: This is the foundation. Your MT5 terminal has some historical data, but for the most accurate variable spread simulation, you might need to download richer tick data from external sources.
- Import tick data into MT5: If using external data, you’ll need to import it. MT5 allows you to import custom historical data through its History Center. (A detailed guide on importing tick data is often found in the MQL5 documentation or specific data provider instructions).
- Configure strategy tester for real tick simulation: In the MT5 Strategy Tester, ensure your "Model" is set to "Every tick based on real ticks." This tells the tester to use the actual historical tick data, including its recorded bid/ask prices and thus the variable spread, for its calculations. If this option isn't available, selecting "Every tick" is the next best alternative, though less accurate for spread.
- Start the backtest: With your high-quality tick data loaded and the correct modeling option selected, run your backtest. The results will now inherently factor in the historical fluctuations of the spread, providing a far more realistic assessment of your strategy's performance.
After analyzing hundreds of strategies, I've noticed a recurring theme: many promising ideas fail in live trading simply because they were backtested on M1 data without accounting for real tick fluctuations, especially the erratic behavior of spread. Making this one change can be the difference between survival and failure for your EA.
2.4. Adjusting spread dynamically for specific conditions
Beyond simply using tick data, savvy traders often consider how spread behaves during specific market conditions and look for ways to adjust their strategy or testing accordingly.
- Understanding session-specific spreads: For example, the Asian session, particularly the hours around the New York close and Sydney open (roughly 5 PM - 7 PM EST or 12 AM - 2 AM WIB), often sees significantly wider spreads due to lower liquidity. If your strategy frequently trades during these hours, you should pay particular attention to how spread impacts its profitability.
- Impact of major news events: Economic news releases (like NFP, CPI, interest rate decisions) can cause spreads to briefly but dramatically widen. Your backtests with real tick data will capture this, but it’s crucial to understand the impact.
- Programming dynamic spread handling: For advanced users, an Expert Advisor can be programmed to read the current real-time spread from the broker and adapt its trading logic. For instance, an EA might be designed to:
- Avoid opening new trades if the spread exceeds a predefined maximum threshold.
- Adjust stop-loss or take-profit levels dynamically based on the current spread.
- Temporarily halt trading during high-impact news events where spreads are known to spike.
These dynamic adjustments, either in your backtest methodology or within the EA's code, are vital for preparing your strategy for the true complexities of the live market.
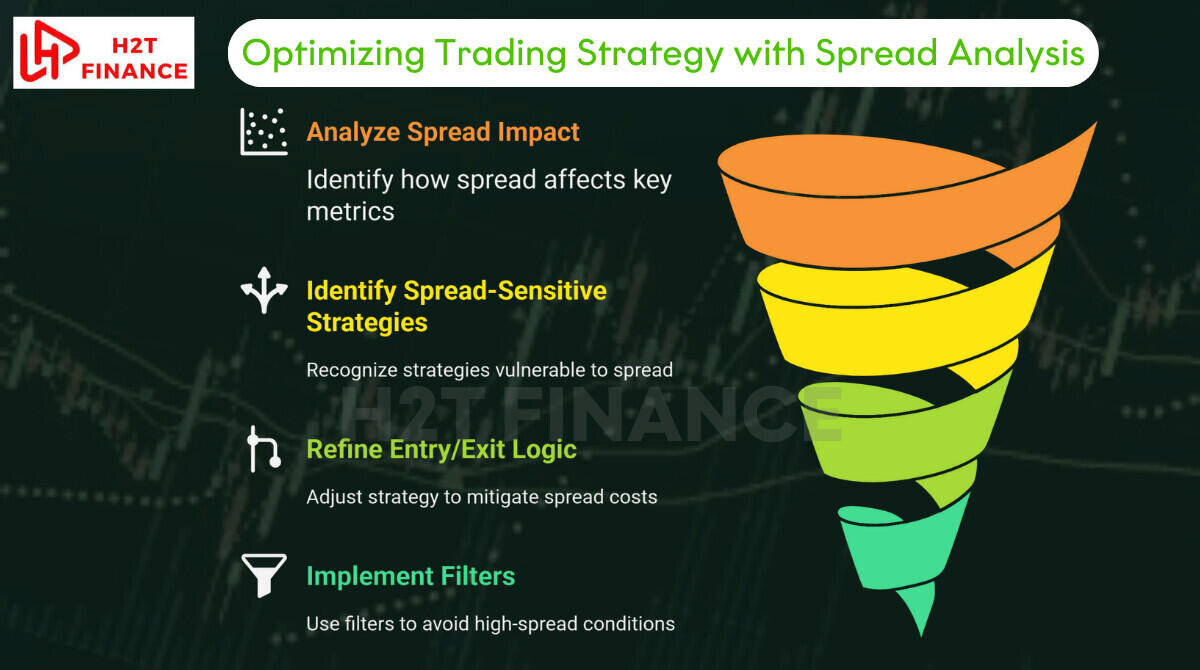
3. Optimizing your strategy: Analyzing backtest results with spread in mind
Running a backtest with spread included is only half the battle. The true value comes from meticulously analyzing the results to understand how transaction costs fundamentally reshape your strategy's performance. Many traders stop at the net profit figure, but a deeper dive into the report reveals far more insights that can help you truly optimize your approach.
3.1. Beyond net profit: What to look for
When you run a backtest, especially with an Expert Advisor (EA), the MetaTrader 5 (MT5) Strategy Tester generates a detailed report. While the "Net Profit" or "Total Net Profit" figure is undeniably important, it shouldn't be your sole focus. The spread significantly impacts other crucial metrics that provide a more honest assessment of your strategy's resilience.
Here’s what you should pay close attention to:
Gross profit vs. Net profit:
This is perhaps the most immediate indicator of spread's impact. Your gross profit represents the total profit from all winning trades, while net profit is what's left after all costs (including spread and commissions) are deducted.
A significant gap between these two figures highlights just how much your strategy is paying out in transaction costs. If your gross profit is healthy but your net profit is meager, the spread is likely eating away at your potential gains.
Drawdown:
Spread can dramatically exacerbate drawdowns, especially for strategies that execute many trades or target very small price movements (like scalping or high-frequency approaches). Each time a trade opens, it immediately starts in negative territory by the amount of the spread.
If your strategy's entry logic isn't precise enough to overcome this initial hurdle, or if you're hitting many small stop losses, the cumulative effect of spread can turn minor pullbacks into deeper, more concerning drawdowns.
Profit factor:
This metric is the ratio of gross profit to gross loss. A higher profit factor is generally better, indicating that your winning trades collectively outweigh your losing ones.
When you introduce spread, both your gross profit tends to decrease (as costs eat into wins) and your gross loss might increase (as losing trades need to overcome spread just to break even before hitting stop loss). This can significantly reduce your profit factor, painting a more realistic, and often less flattering, picture of your strategy's efficiency.
Average trade profit/loss:
This simple but powerful metric directly shows how spread impacts the profitability of each individual trade. Without spread, a winning trade might show an average gain of 5 pips. With a 2-pip spread, that same trade's net gain immediately drops to 3 pips.
Conversely, a losing trade might need to move 2 pips further against you just to cover the spread before hitting its stop loss, increasing your average loss.
By examining these metrics, you gain a clearer understanding of your strategy's true cost structure and its sensitivity to transaction fees. It's about looking at the full financial statement, not just the revenue line.
3.2. Identifying "spread-sensitive" strategies
Not all strategies are equally affected by spread. Some, by their very nature, are far more vulnerable to increased transaction costs. Recognizing these "spread-sensitive" strategies is key to knowing where to focus your optimization efforts.
3.2.1. Scalping strategies
These strategies aim to capture tiny price movements, often just a few pips, and execute a very high volume of trades. For a scalper targeting 5 pips of profit, a 2-pip spread eats up a massive 40% of the potential gain.
If the spread widens even slightly, such strategies quickly become unprofitable. From my experience, strategies designed to capture tiny moves almost always crumble when realistic spreads are applied; they need extremely tight costs to be viable.
3.2.2. Breakout strategies
While often targeting larger moves, breakout strategies are prone to entering trades during periods of increased volatility, precisely when spreads tend to widen. An entry triggered at a breakout point might occur at a less favorable price due to a widened spread, diminishing the initial momentum the strategy relies upon.
3.2.3. Strategies trading during illiquid hours
The Forex market operates 24/5, but liquidity isn't constant. The transition period around the New York close and Sydney open (typically between 12 AM to 2 AM WIB, or 5 PM to 7 PM EST) is notorious for low liquidity and significantly wider spreads.
Strategies that frequently open or close trades during this window will face substantially higher costs than those operating during peak liquidity hours (like the London or New York sessions). The challenge of this specific "New York close / Sydney open" window is a critical consideration for any overnight positions or trades initiated then.
If your backtest results dramatically worsen after incorporating realistic spread, it's a strong signal that your strategy might fall into one of these sensitive categories, requiring further refinement.
3.3. Refining your entry/exit logic
Once you identify how spread is impacting your strategy, the next logical step is to refine its entry and exit logic to mitigate these costs. It's not about eliminating spread, but about designing your strategy to absorb it more effectively.
3.3.1. Addressing unprofitable entries
A "perfect" entry point identified without spread might become unprofitable when the initial cost is factored in. Consider adjusting your entry criteria to demand a slightly stronger signal or more favorable market conditions.
You might need to wait for clearer momentum to ensure that the initial jump in price is large enough to immediately overcome the spread and put the trade into positive territory.
3.3.2. Considering a wider buffer for stop loss and take profit
For some strategies, especially those targeting larger moves, a slight adjustment to your Stop Loss (SL) and Take Profit (TP) levels can account for the spread.
For instance, if your strategy aims for a 50-pip TP, you might need to factor in an additional 2-3 pips to ensure your actual net profit target is met after spread. Similarly, your SL might need a bit more breathing room.
3.3.3. Understanding pending orders and spread
When using pending orders like Buy Limit/Stop or Sell Limit/Stop, be mindful of how spread affects their activation and initial profitability. A Buy Limit order, for example, is filled at the Ask price, while a Sell Limit is filled at the Bid price.
This means if you're trying to buy at a specific Bid price, your order might actually fill slightly higher (at the Ask), immediately costing you the spread. Conversely, a Sell Stop order will trigger at the Bid price, but your actual fill might be at a less favorable Bid price during volatile conditions. This nuance is critical for precision trading.
3.4. The power of filtration: Avoiding high-spread conditions
Sometimes, the best optimization isn't about adapting to spread, but about avoiding the conditions where it becomes excessive. Implementing intelligent filters within your Expert Advisor can significantly enhance robustness.
3.4.1. Implementing time filters in your EA
If your analysis shows that your strategy performs poorly during specific hours (e.g., the Asian session or during very early European session hours when spreads might still be wider), you can program your EA to simply not trade during those periods. This is a straightforward yet highly effective way to sidestep high-cost windows.
3.4.2. Implementing a spread filter in your EA
This is a more dynamic and powerful approach. Your EA can be designed to query the current spread of the currency pair it's trading. You can then set a rule: only take a trade if the current spread is below a predefined maximum threshold.
For instance, if your strategy is highly sensitive to spread, you might only allow trades if the spread on EUR/USD is 1.5 pips or less. If the spread widens to 3 pips, the EA simply waits until conditions improve.
This proactive approach ensures that your strategy only engages in the market when transaction costs are within an acceptable range, significantly improving its live trading robustness.
By strategically analyzing your backtest results with spread in mind and implementing these refinement techniques, you move closer to a trading system that's not just theoretically profitable but genuinely viable in the dynamic, often challenging, real-world Forex market.
4. Common backtesting pitfalls (And how to avoid them)
Even with the right intentions, traders often stumble into common traps when backtesting their strategies, particularly concerning how they handle spread.
These mistakes can lead to a false sense of security, where a strategy appears robust in simulation but crumbles under the pressures of live trading. Understanding these pitfalls is crucial for creating truly reliable backtests.
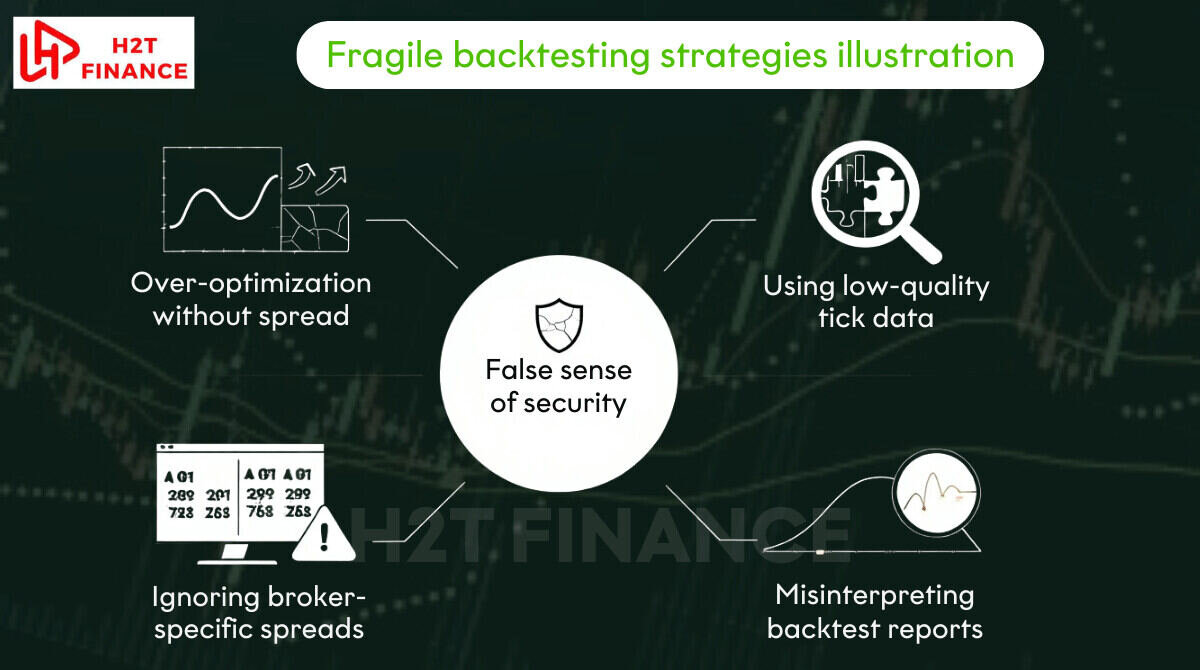
4.1. Over-optimization without spread
This is arguably one of the most common and dangerous mistakes. Over-optimization occurs when you tweak your strategy's parameters excessively to fit past historical data, often resulting in spectacular backtest curves.
The danger here is that the strategy becomes highly specialized for the specific quirks of that historical period, rather than being robust for future, unknown market conditions.
When this over-optimization is done without considering the realistic impact of spread, the problem is compounded. A strategy that shows amazing performance with zero or an unrealistically low fixed spread will almost certainly fail in a live environment.
It's like trying to win a marathon by training on a perfectly flat, downhill track – the moment you encounter real hills and headwinds, your performance collapses. The solution is straightforward but vital: always include realistic spread during the optimization process.
Don't optimize first and then add spread as an afterthought. Integrate spread from the very beginning of your testing and optimization cycles. This ensures that your chosen parameters are resilient to actual transaction costs, rather than just performing well in an idealized, cost-free vacuum.
4.2. Using low-quality tick data
The adage "garbage in, garbage out" applies perfectly to backtesting. The accuracy of your backtest is fundamentally dependent on the quality of the historical data you feed into your strategy tester. If your data doesn't accurately reflect past market conditions, including precise bid and ask prices and their fluctuations, your results will be misleading.
Low-quality tick data can manifest in several ways:
- Missing data: Gaps in historical data can lead to inaccurate trade executions or skipped signals.
- Synthesized tick data: Some MT4 backtesting, for instance, uses a basic M1 data model to generate synthetic ticks, which doesn't capture the true volatility and spread variations that real tick data offers.
- Lack of Bid/Ask information: Crucially, for accurate spread simulation, your historical data must contain both bid and ask prices, not just mid-prices or single quotes.
The importance of accurate historical data, including granular bid/ask information, cannot be overstated. For serious backtesting, especially on MT5, investing time in sourcing and importing high-quality tick data from reputable providers is a non-negotiable step.
Without it, even with the right settings, your backtest might not fully capture the real impact of how to add spread into the strategy tester backtesting.
4.3. Ignoring broker-specific spreads
It's a common misconception that spreads are uniform across all brokers. In reality, spreads vary significantly from one broker to another, even for the same currency pair. Factors like the broker's liquidity providers, business model (ECN, STP, Market Maker), and even account type can influence the average spread you encounter.
I've noticed that traders often test with generic, idealized spreads, which can be incredibly misleading if their live broker has higher, more volatile, or simply different spread characteristics.
For a truly realistic backtest, you should strive to use your actual broker's average spread data for the specific currency pairs and trading times your strategy targets. Some brokers provide historical spread data, or you can track it yourself on a demo account.
Failing to account for these broker-specific nuances can lead to a strategy that performs well in your backtest environment but consistently underperforms or even loses money with your chosen live broker.
4.4. Misinterpreting backtest reports
Finally, a pitfall that often undoes all the hard work of accurate data and settings is simply misinterpreting the backtest report itself. It's easy to focus solely on the "final equity curve" or the "total net profit" and overlook the finer details.
A comprehensive backtest report from MT5 offers a wealth of information:
- Detailed trade list: Review individual trades. Do profitable trades consistently overcome the spread? Do losing trades show disproportionate losses due to spread?
- Drawdown metrics: Pay attention to Maximum Drawdown, Relative Drawdown, and Maximum Consecutive Losses. How do these compare when spread is included versus excluded?
- Profit factor, expectancy, recovery factor: These metrics tell you more about the quality of your profits and the robustness of your strategy, not just the quantity.
Focusing only on the "final equity curve" without understanding the underlying costs and the granular impact on each trade is a recipe for disappointment. A seemingly smooth equity curve might hide a strategy that barely breaks even after spread, or one that is highly vulnerable to small increases in transaction costs.
True analysis involves digging deep into the report to understand where and how spread is impacting performance.
5. Beyond MT5: Other Tools and considerations
While MetaTrader 5 (MT5) is an incredibly powerful platform for detailed backtesting, especially concerning variable spreads and tick data, it's not the only tool out there. Traders often utilize a combination of platforms for different aspects of strategy development. Understanding the strengths and limitations of each can help you build a more holistic approach to refining your trading systems.
5.1. Brief comparison: MT4 vs. MT5 for spread testing
For years, MetaTrader 4 (MT4) was the undisputed king of retail Forex trading platforms. Many Expert Advisors (EAs) were, and still are, developed for MT4. However, when it comes to rigorous backtesting, especially with realistic spread modeling, MT5 offers distinct advantages that make it the superior choice for serious strategy evaluation.
5.1.1. MT4's limitations
MT4's built-in Strategy Tester primarily relies on "control points" or "every tick" models that, while useful, don't accurately simulate variable spreads or real tick data to the same granular level as MT5.
While you can input a fixed spread value for your backtest in MT4, it lacks the native capability to truly account for the dynamic, fluctuating spreads seen in live markets. Some third-party tools like Tick Data Suite (TDS) have emerged to enhance MT4's backtesting by providing actual variable spread simulation, but this requires an additional layer of software.
5.1.2. MT5's clear advantage
MT5 was designed with multi-asset trading and more sophisticated analytical capabilities in mind. Its "Every tick based on real ticks" model, combined with its ability to easily handle massive amounts of high-quality historical tick data (which includes precise bid and ask price streams), gives it a significant edge.
This means that when you're learning how to add spread into the strategy tester backtesting, MT5 offers a far more authentic simulation of real market conditions, providing results that are much closer to what you'd experience live. This fundamental difference makes MT5 invaluable for strategies sensitive to price action and transaction costs.
5.2. TradingView's role in strategy development
TradingView has rapidly become a favorite charting platform for millions of traders due to its intuitive interface, vast array of indicators, and powerful charting tools. It also offers a "Strategy Tester" feature for its Pine Script-based strategies.
5.2.1. Excellent for charting and initial strategy visualization
TradingView excels at allowing you to quickly prototype, visualize, and backtest a strategy directly on the charts. It's fantastic for visual analysis, identifying patterns, and getting a conceptual feel for how a strategy might perform. Its user-friendly script editor (Pine Script) makes it accessible for both beginners and experienced coders to automate ideas.
5.2.2. Limitations for detailed backtesting with variable spread
While TradingView's backtester is improving, it generally lacks the granular control over tick data and variable spread simulation that dedicated platforms like MT5 provide. The backtest results on TradingView might still present an idealized view compared to a rigorous MT5 backtest with high-quality tick data.
For strategies where every pip and fractional pip of spread matters, or for high-frequency EAs, TradingView serves better as a robust tool for initial concept validation and visualization rather than the final, highly accurate backtest.
For those deeply focused on how to add spread into the strategy tester backtesting with utmost precision, MT5 remains the more specialized instrument.
5.3. The human element: When to trust your backtest (and when not to)
Ultimately, while backtesting is an indispensable tool, it's crucial to remember its limitations. A backtest is a simulation of the past, not a guarantee of future performance.
5.3.1. Backtesting is a tool, not a crystal ball
The market is dynamic, constantly evolving with new participants, technologies, and macroeconomic factors. A strategy that performed flawlessly over the last five years might encounter entirely different market behavior in the next five. Market conditions change, and past performance is never, ever indicative of future results.
5.3.2. The importance of demo trading after backtesting
Even after the most rigorous backtesting, including meticulously figuring out how to add spread into the strategy tester backtesting, the next logical step is to deploy your strategy on a demo account.
This "forward testing" in a live, real-time environment (albeit with virtual money) exposes your strategy to real-time market data, actual broker execution, and current spreads without financial risk. It's the bridge between theoretical backtest perfection and the unpredictable reality of live trading.
5.3.3. Continuous monitoring and adaptation
A truly successful algorithmic trading journey involves continuous monitoring of your live strategy's performance, comparing it against your backtest expectations, and adapting your strategy as market conditions or broker execution changes. The most effective traders don't just "set and forget"; they iterate and refine.
Explore more trading insights:
- MT5 vidula mode does not work: Get it fixed
- How to draw equidistant channel: A complete guide
- Script apply same template to all charts: Master your views
6. Frequently asked questions (FAQs)
Understanding spread and its impact on backtesting often leads to more questions. Here are some of the most common inquiries we encounter:
6.1. What is spread in Forex?
Spread in Forex is the difference between the bid (sell) price and the ask (buy) price of a currency pair. It's essentially the cost you pay to your broker for executing a trade, representing their compensation.
6.2. Why is it necessary to add spread to backtests?
Adding spread to backtests is crucial because it simulates the real-world transaction costs you incur in live trading. Without it, your backtest results will be overly optimistic, failing to account for a significant expense that can dramatically impact your strategy's true profitability and drawdown.
6.3. How can I find the average spread for a currency pair?
You can typically find average spread information on your broker's website, often in their contract specifications or pricing pages. Alternatively, you can monitor live spreads on a demo account during different market sessions, or use third-party tools like Myfxbook's spread tracking feature to get historical averages for various brokers and pairs.
6.4. Can MT4 backtest with variable spread?
While MT4's built-in Strategy Tester allows for fixed spread input, it does not natively support backtesting with variable (fluctuating) spreads using real tick data. To achieve variable spread backtesting in MT4, you generally need to use third-party tools that enhance its capabilities. MT5 offers native variable spread backtesting with real tick data.
6.5. What is the importance of tick data (tick data) in backtesting?
Tick data is the most granular form of historical price data, recording every single bid and ask price change. Its importance in backtesting lies in its ability to accurately simulate the smallest price movements and, crucially, the real-time fluctuations of the spread.
Using high-quality tick data ensures your backtests are as close to real market conditions as possible, providing a highly reliable assessment of your strategy's performance.
7. Conclusion: Trading with your eyes wide open
The journey of developing a truly profitable and robust trading strategy is rarely a straight line. It’s filled with refinement, re-evaluation, and a deep dive into the nuances that separate theoretical gains from actual market performance.
One of the most significant, yet often overlooked, factors in this journey is the humble spread. By now, it should be clear that understanding how to add spread into the strategy tester backtestingn isn't merely a technicality; it's a fundamental pillar of realistic strategy evaluation.
Ultimately, developing a trading strategy isn't just about the numbers on a backtest report. It's about building genuine confidence in your system. By facing the hard truth of trading costs head-on from the very beginning, you aren't just creating a more accurate backtest; you're building a more realistic trading mindset. Don't let pretty numbers fool you.
At H2T Finance, our goal is to equip you with the knowledge and tools to navigate the markets with clarity and confidence. We believe that demanding accuracy from your backtests is the first step towards a more empowered trading journey.
Don't let your backtests lie to you; demand accuracy, understand your costs, and trade with your eyes wide open. For more foundational insights into the market, explore our comprehensive Forex Basics section, where we demystify key concepts to help you build a solid trading foundation.