Think of the graph euro vs dollar not just as data, but as the live scoreboard in an ongoing economic match between the U.S. and the European Union. At a glance, it tells you exactly how much a single euro is "worth" against the US dollar, weaving a story of the power struggle between two leading economies.
For curious beginners exploring currency markets or aspiring Forex traders, mastering this graph is your gateway to understanding the forces shaping international finance.
Far more than a line or candlestick chart, the EUR/USD pair mirrors the push and pull of two economic giants. Central banks, traders, and investors scrutinize its every move, knowing that even a slight shift on the graph euro vs dollar can ripple across trade, inflation, and global investments. For instance, its trend over the past year shows the complex interaction between economic policies and investor confidence.
This guide is designed to strip away that complexity. We're going to break down the graph euro vs dollar piece by piece, so you can learn to read its patterns, find reliable live charts, and understand what makes the numbers tick. The goal is for you to be able to look at the currency market with more clarity and confidence. Let's get started!
1. What is the graph euro vs dollar?
Before diving into market analysis or trading strategies, it’s essential to understand what the euro vs dollar graph actually shows. At its core, this graph displays the historical and real-time price movements of the EUR/USD currency pair and how many U.S. dollars (USD) one euro (EUR) can buy at any given moment.
1.1. Understanding the basics
The graph is a visual representation of the exchange rate over time. It allows you to track:
- How the value of the euro has changed against the dollar,
- At what times significant price swings occurred,
- And overall trends whether the euro is appreciating or depreciating.
In most graphs, the X-axis represents time, and the Y-axis represents price. You’ll typically see prices fluctuating throughout the day, week, or year, depending on the time frame you select.
1.2. Common types of euro vs dollar graphs
There are several chart types used to visualize EUR/USD movements:
- Line charts: Simple and easy to read, they connect closing prices over a selected period.
- Candlestick charts: Popular among traders, these display opening, closing, high, and low prices for specific intervals (e.g., hourly, daily).
- Area charts: Similar to line charts but with the area below the line filled in, helping emphasize direction.
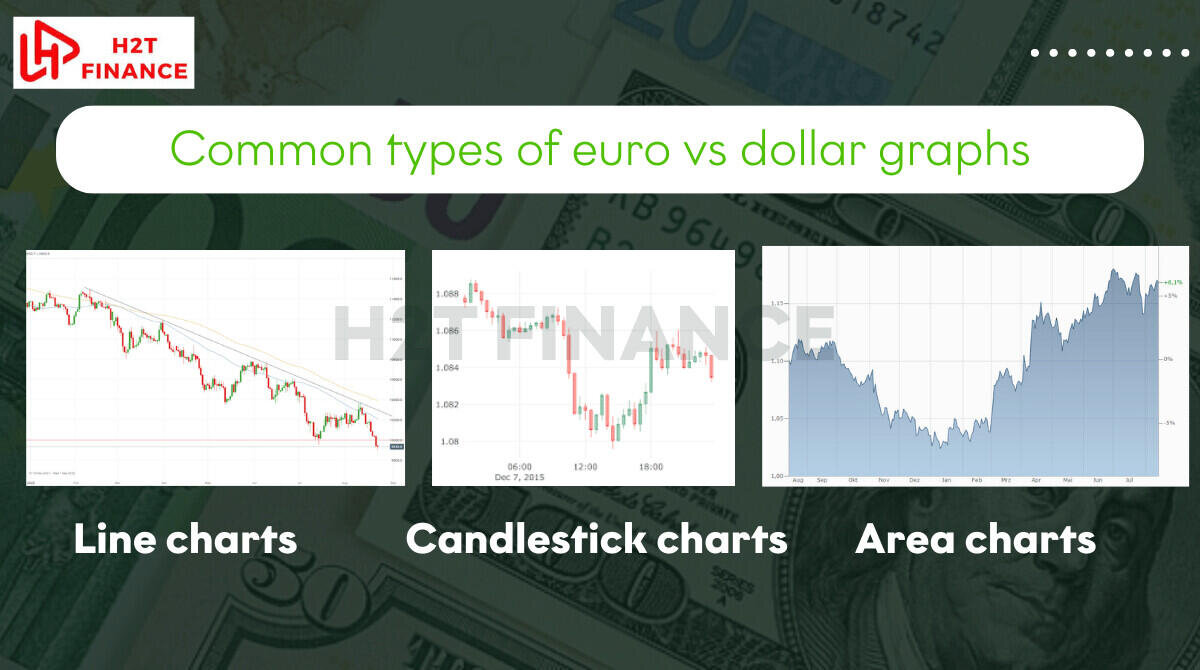
Each chart type serves different purposes. For example, candlestick charts are best for technical analysis, while line charts offer a cleaner overview of long-term movement.
1.3. Why graph euro vs dollar is the most traded currency pair
So why is the graph of euro vs dollar the one that everyone, from massive banks to beginners, seems to be watching? The answer is a mix of power and predictable volatility.
On one hand, you're dealing with the world's two largest and most liquid currencies. On the other, both central banks (the ECB and the Fed) constantly make policy moves, creating waves that traders of all levels want to ride.
Because of its high liquidity and relatively stable spreads, the graph of euro vs dollar is often the first chart aspiring Forex traders learn to read.
2. How to read the EUR/USD chart for beginners
Now that you understand what the euro vs dollar graph represents, the next step is learning how to read it. While charts can seem overwhelming at first, breaking them down into core components makes them much easier to understand even for beginners.
The graph euro vs dollar displays how the exchange rate between the euro and the dollar changes over time. To read it effectively, you need to grasp three main concepts: timeframes, axes, and trends.
2.1. Choosing the right time frame
Every chart offers different time frames depending on what you're trying to observe. Here's a quick breakdown:
- Intraday (1-minute to 1-hour): Useful for short-term moves and day traders.
- Daily or weekly: Shows broader trends, better for beginners analyzing long-term patterns.
- Monthly: Helps visualize economic cycles and historical highs/lows.
As a beginner, start with daily or weekly timeframes to identify larger movements without the noise of minute-to-minute fluctuations.
2.2. Understanding chart axes
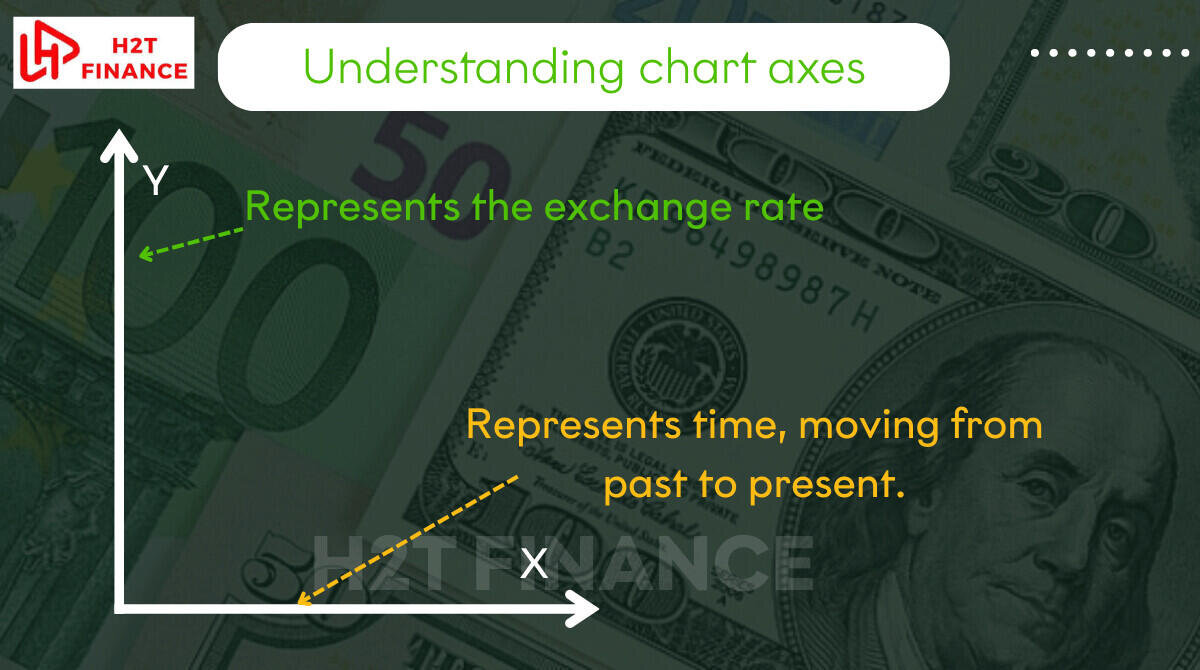
- X-axis (horizontal): Represents time, moving from past to present.
- Y-axis (vertical): Represents the exchange rate, or how many US dollars one euro equals.
As the line or candlesticks move up, it means the euro is gaining strength against the dollar. A downward movement shows the opposite the dollar is gaining against the euro.
2.3. Identifying trends
Trends help you understand the market sentiment:
- Uptrend: A series of higher highs and higher lows → euro is strengthening.
- Downtrend: A series of lower highs and lower lows → dollar is gaining ground.
- Sideways trend: The rate fluctuates within a narrow range → market indecision.
US dollar vs euro graph trend snapshot: Looking at recent data, we can see: The exchange rate has experienced daily fluctuations, reflecting shifts in market sentiment. Over the past year, the pair has shown a notable upward trend, reflecting economic recovery and differences in monetary policy between the regions.
By regularly checking the euro vs dollar graph, beginners can build a feel for price behavior and start forming simple trade ideas or observational habits even before entering the market.
3. Graph Euro vs Dollar trend: What’s happening now?
Understanding the current trend of the graph euro vs dollar helps you see the bigger picture. Even if you're not actively trading, being aware of how the euro vs dollar graph is moving can improve your financial awareness and support your Forex learning journey.
3.1. Recent exchange rate performance
To evaluate the EUR/USD pair's performance, you should check the euro vs dollar graph on a reliable financial platform. Instead of looking at a single number, analyze the broader context:
- Daily comparison: The rate changes constantly. See if it has increased or decreased compared to the previous day to get a feel for the short-term trend.
- One-Year lookback: Comparing the current rate to one year ago reveals the long-term trend. For example, as of mid-July 2025, the EUR/USD pair has appreciated by approximately 6.31% over the past 12 months.
- Recovery from lows: Looking at a broader timeframe, the EUR/USD pair has recovered strongly since 2022, when it briefly reached parity (1 EUR = 1 USD) and even dropped below it. The current trend reflects a euro that is strengthening against the US dollar.
3.2. Year-long growth and short-term shifts
While the long-term trend may show euro appreciation, short-term fluctuations (weekly or monthly) can move against this trend. These shifts are often driven by economic reports or news events.
Observing the consistency of the trend on the graph of euro vs dollar is crucial. For instance, a strong bullish momentum is indicated when the price consistently forms higher highs and higher lows on weekly and monthly charts.
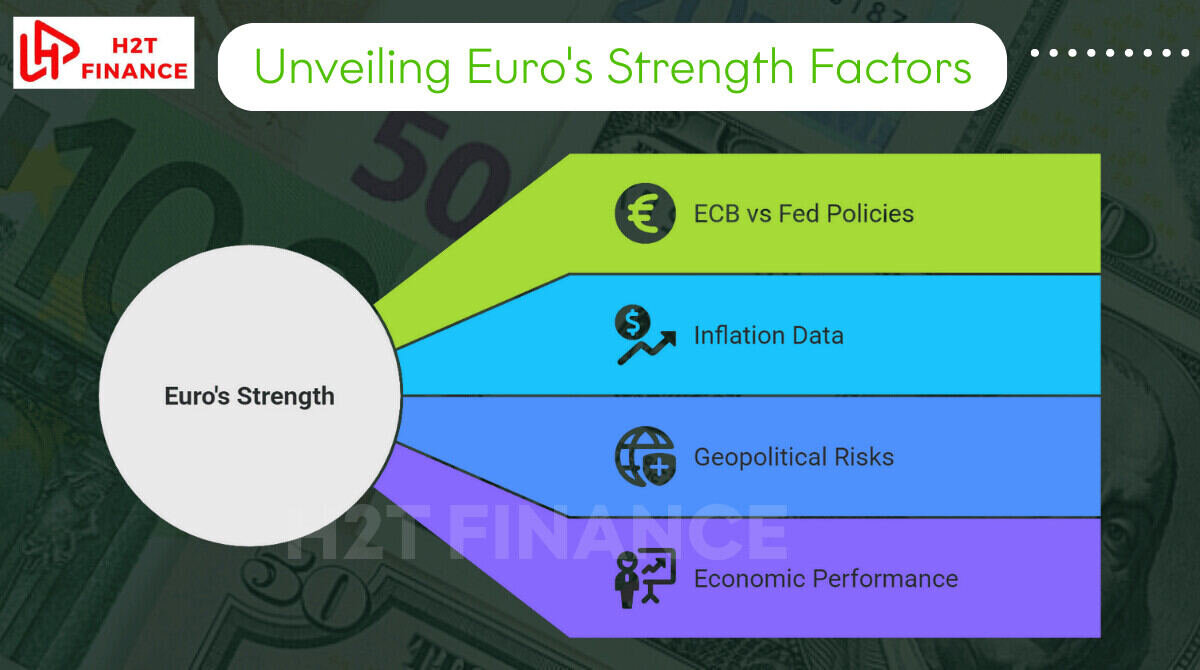
3.3. Key factors influencing the current trend
- ECB vs Fed interest rate policies: If the European Central Bank tightens policy while the U.S. Federal Reserve pauses or cuts rates, the euro gains strength.
- Inflation data: Slower inflation in the U.S. and persistent price pressures in the EU support a stronger euro.
- Geopolitical risks: Shifts in global risk sentiment often impact the USD, traditionally seen as a safe haven.
- Economic performance: Better-than-expected growth in the eurozone or weaker data from the U.S. can influence the trend.
At the moment, analysts expect the EUR/USD pair to stabilize around 1.15 by the end of the quarter, according to TradingEconomics. While this is not investment advice, it offers a neutral reference point for your chart observations.
4. Why do EUR/USD rates change?
If you’ve ever looked at a graph euro vs dollar and wondered why the line keeps moving, you’re not alone. Currency exchange rates fluctuate constantly due to a combination of economic, political, and psychological factors. Even small shifts can reflect major changes in global sentiment or macroeconomic conditions.
4.1. Understanding the forces behind EUR/USD movements
The euro vs dollar graph changes in real time, influenced by a wide range of global events. Below are the key drivers that cause the EUR/USD rate to rise or fall:
4.1.1. Interest rate decisions (ECB vs Fed)
One of the most powerful influences is the interest rate policy set by central banks:
- If the European Central Bank (ECB) raises interest rates while the U.S. Federal Reserve holds or cuts theirs, the euro tends to strengthen.
- Conversely, if the Fed increases rates, the dollar may gain against the euro.
Higher interest rates typically attract more foreign capital, increasing demand for the currency.
4.1.2. Inflation and economic data
Important economic indicators such as:
- Inflation (CPI)
- GDP growth
- Employment figures
- Consumer confidence
4.1.3. Political and geopolitical stability
Markets don’t like uncertainty. Political turmoil in either region whether it's EU elections, U.S. debt ceiling debates, or conflicts can drive volatility on the graph of euro vs dollar.
4.1.4. Market sentiment and speculation
Trader behavior matters. Even rumors or expectations of future decisions can influence the graph dollar vs euro. For example:
- If traders anticipate an ECB rate hike, the euro may rise before the actual decision is made.
- Sudden news (like a surprise economic report) can cause immediate price spikes or drops.
4.2. Summary of key influences on EUR/USD
| Factor | Impact on EUR/USD |
|---|---|
| Higher ECB rates | Euro strengthens |
| Strong EU economic data | Euro strengthens |
| Political instability (EU) | Euro weakens |
| Higher Fed rates | Dollar strengthens (EUR/USD falls) |
| Risk aversion in markets | Dollar often strengthens as a safe haven |
Understanding these drivers helps you read the chart with more confidence. Instead of seeing random ups and downs, you’ll begin to recognize patterns and causes behind the price action.
5. Graph dollar vs euro: Is it the same as euro vs dollar?
If you’re searching for both “graph euro vs dollar” and “graph dollar vs euro,” you might wonder are they the same thing? Technically, yes, but they present the data from opposite perspectives. The key difference lies in which currency is being used as the base and which is the quote.
5.1. Base currency vs quote currency
In the EUR/USD pair:
- EUR is the base currency
- USD is the quote currency
In contrast, if you're looking at USD/EUR, you're asking:
- How many euros can one dollar buy?
- That’s the inverse of the EUR/USD rate.
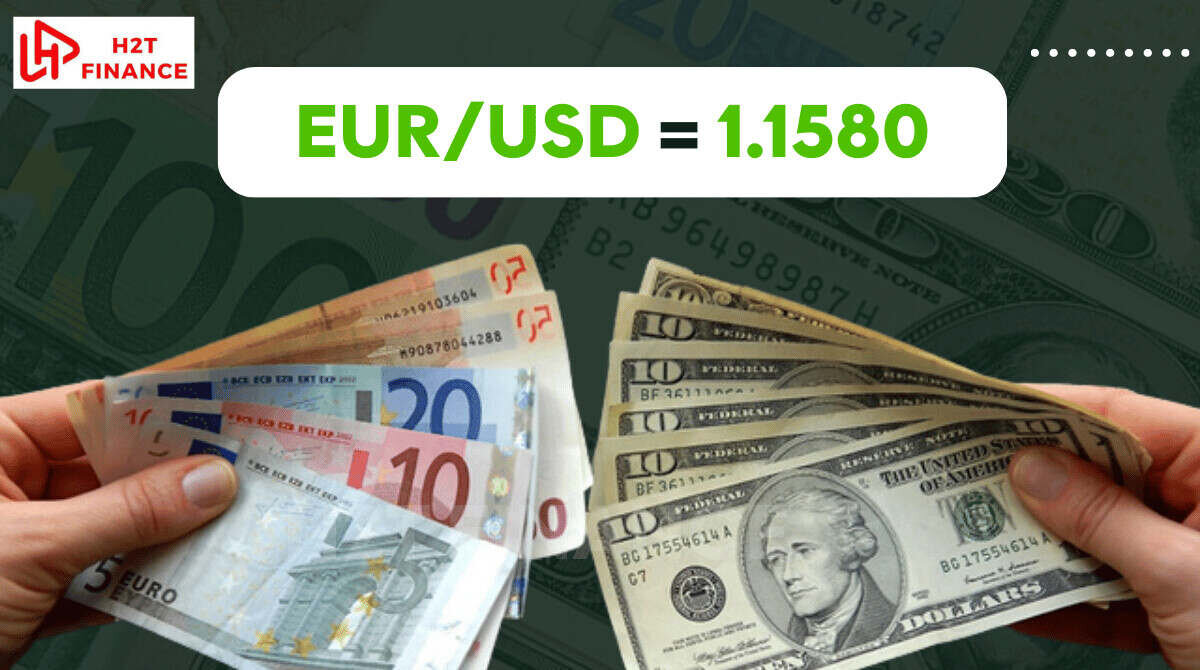
Using the same data:
1 / 1.1580 ≈ 0.864 → So, 1 USD ≈ 0.864 EUR
5.2. $100 in USD is worth how much in euros?
To convert: $100 / 1.1580 ≈ €86.40. This conversion helps answer a common question: “How much is $100 in euros?”. Based on this example exchange rate, it would be approximately €86.40.
5.3. Why the distinction matters
Understanding whether you’re viewing a graph of euro vs dollar or dollar vs euro graph is important for:
- Setting up trading platforms correctly (especially on MT4 or TradingView)
- Reading price movement accurately (uptrend in EUR/USD = euro strengthening)
- Avoiding confusion when comparing data across websites or financial reports
Some platforms allow you to flip the chart view or compare inverse pairs side-by-side, which is useful when interpreting both perspectives.
6. How to use the euro vs dollar graph in your Forex learning
For beginners stepping into the world of Forex, the euro vs dollar graph isn’t just a tool for experts it's a valuable learning resource. Observing how this major currency pair behaves can teach you foundational concepts like trends, volatility, and market timing, all without placing a single trade.
6.1. Why beginners should study the EUR/USD chart
EUR/USD is an ideal starting point for Forex learners because:
- It’s the most liquid pair in the market, ensuring smoother price action.
- News that impacts it is widely covered, making it easier to connect cause and effect.
- It offers a balance of predictability and volatility, suitable for building analytical skills.
By studying the graph euro vs dollar over time, you’ll begin to recognize patterns price spikes after economic reports, slow drifts during low-volume hours, or sharp reversals after central bank meetings.
6.2. Practical ways to use the graph euro vs dollar as a learner
6.2.1. Observe price patterns
Watch how prices behave after key events:
- ECB or Fed announcements
- Inflation releases
- Nonfarm payrolls (NFP) reports
Mark these on the chart and look for recurring shapes or reactions.
6.2.2. Understand volatility zones
The EUR/USD pair often moves more during:
- London and New York sessions
- Economic news hours
Use chart tools to highlight volatile periods and calmer zones to get a feel for timing.
6.2.3. Avoid beginner mistakes
When first exploring the graph of euro vs dollar, it’s easy to fall into these traps:
- Over-interpreting short-term fluctuations
- Mistaking noise for trend
- Jumping into “predictions” without context
Instead, focus on observation and pattern recognition, not prediction or profit.
6.3. Start with simple analysis
Try:
- Identifying the current trend (up, down, or sideways)
- Spotting support and resistance levels
- Using basic indicators like moving averages
These actions help you build comfort with the chart interface and market behavior.
Start your next learning step here:
7. FAQs: Related questions about graph euro vs dollar
When people search for the graph euro vs dollar, they often have specific follow-up questions in mind. Let’s explore some of the most common ones based on search data and provide simple, neutral answers backed by recent insights.
7.1. Is the dollar going up or down against the euro?
Currently, the general trend indicates that the euro is strengthening against the U.S. dollar. When observing the euro vs dollar graph, one can see that the exchange rate has maintained a long-term upward trend, such as over the past 12 months. This indicates that the dollar is weakening in relative terms against the euro.
7.2. What is the prediction for euro vs USD?
According to recent projections from TradingEconomics, the EUR/USD rate is expected to trade around 1.15 by the end of the quarter.
Keep in mind:
- These are not guarantees.
- Market conditions like interest rate decisions, inflation data, or geopolitical events can change the forecast quickly.
Analysts suggest cautious optimism, but exact outcomes depend on evolving macroeconomic factors.
7.3. How much is $100 US in euros?
As of an example rate (let's say 1 EUR = 1.1580 USD): $100 USD ≈ €86.40 EUR.
7.4. What’s stronger, the euro or the dollar today?
It depends on how you define "stronger":
- Numerically, $1 is worth less than €1, so the euro is stronger in face value.
- Market influence, however, depends on interest rates, demand for safe havens, and global confidence in each economy.
Today, the euro has appreciated more than the dollar over the past year, but that doesn’t always mean it's stronger in every context.
8. Final thoughts: Watching the graph of Euro vs Dollar as a beginner
At the end of the day, the graph euro vs dollar isn't some mystical code; it's a tool that tells a story. As a beginner, your first job isn't to predict the future, but simply to get comfortable reading that story.
Think of it less as a final exam and more as learning a new language. The more you immerse yourself in it, the more fluent you'll become. Your path to trading confidence begins not with a big risky trade, but with that first curious glance at the chart.
Here’s how to keep growing:
- Stay curious: Dive into the Currency Pairs section at H2T Finance to explore how EUR/USD behaves alongside other major pairs.
- Practice regularly: Observe live charts daily to spot trends and build confidence in reading price action.
- Learn patiently: Start with simple tools like moving averages before tackling complex strategies.
Ready to deepen your Forex journey? Visit H2T Finance today to access free resources, live EUR/USD charts, and expert insights. Start watching the graph euro vs dollar with purpose your path to trading confidence begins now!