If you're new to forex trading, the numbers, graphs, and strange terms can be overwhelming. Don't worry — you're not alone! Many successful forex traders just started right from where you are. One of the best ways to help you trade smarter is to learn technical analysis. This is a method of using price charts and patterns to forecast where the market will move next.
In this guide, we’ll explain forex technical analysis in simple and beginner-friendly language. By the end, you’ll know how to read charts and trade more confidently!
Key takeaways:
- Forex technical analysis is a method of analyzing past price movements using charts and technical indicators to predict future price trends.
- Technical analysis is based on the hypothesis that all market information is already reflected in current prices and that price history tends to repeat itself.
- Unlike fundamental analysis, technical analysis focuses on price action and market patterns rather than macroeconomic factors.
- Core concepts include price trends, support and resistance, trendlines, moving averages, and oscillators such as RSI and MACD.
- There are four common chart types: line chart, bar chart, area chart, and candlestick chart, with candlestick charts being the most widely used tool.
- Technical analysis helps identify effective entry and exit points, recognize reversal signals, and take advantage of price fluctuations in the market.
- This tool is flexible, applicable across various timeframes and asset types, and suitable for both beginners and professional traders.
- Limitations of technical analysis include its inability to guarantee absolute accuracy, potential overwhelm for beginners due to the variety of indicators, and the fact that no strategy is 100% effective.
- Combining technical analysis with risk management and trading discipline enhances effectiveness and increases the chances of long-term success in the forex market.
1. What is technical analysis?
In this section, we will take a deeper look into the nature, fundamental principles, and the role of technical analysis in forex trading, especially for beginners.
1.1. Definition of technical analysis
Technical analysis is a method used by traders to study past price movements through charts in order to predict future price trends and behavior. Instead of guessing or relying on emotions, technical analysis helps you look at historical data to understand how prices move and identify important patterns, support, and resistance levels.
Technical analysis is based on the hypothesis that all existing market information is already fully reflected in the price. Therefore, monitoring charts and technical indicators is an effective way to capture the market’s rhythm and trends. An important principle of technical analysis is that “history tends to repeat itself,” meaning price patterns that appeared before are likely to reoccur, helping traders make reasonable trading decisions.
Interestingly, technical analysis does not guarantee precise future predictions but rather evaluates the probabilities based on historical signs and patterns. Practitioners of technical analysis are often called “technical traders” or “chartists” because they primarily use charts to observe the market.
Summary of the main characteristics of technical analysis:
- Based on analyzing historical price movements to predict possible future developments
- All market information is reflected in current prices
- Focuses on charts and technical indicators such as trend lines, support-resistance levels, oscillators (RSI, MACD, etc.)
- Helps identify price patterns and suitable entry/exit points
- Built on the principle of history repeating itself and market crowd psychology
- Does not promise absolute accurate predictions but assesses probabilities and likelihoods
- Suitable for both beginners and professional traders
1.2. Differentiating fundamental analysis and technical analysis
In Forex trading, there are two popular analysis methods to understand and forecast the market: Fundamental analysis and technical analysis.
- Fundamental analysis: Focuses on macroeconomic factors such as economic indicators, interest rates, inflation, and global news that affect the value of a currency. If a country’s economy performs well, its currency tends to appreciate. Fundamental analysis helps explain why the market moves, i.e., it focuses on the underlying causes.
- Technical analysis: Emphasizes past price movements shown through charts and technical indicators. Instead of delving into the fundamental causes, technical analysis focuses on “what is happening in the market” — the price action and current trends to predict the next direction. It is a useful tool that helps traders identify entry and exit points based on actual data.
Combining both methods can provide traders with a more comprehensive view and enable more accurate decision-making.
2. Key concepts in forex technical analysis
Before you start making trades, you must understand the core ideas behind technical analysis for beginners. The principles allow you to read price action and find opportunities in the market.
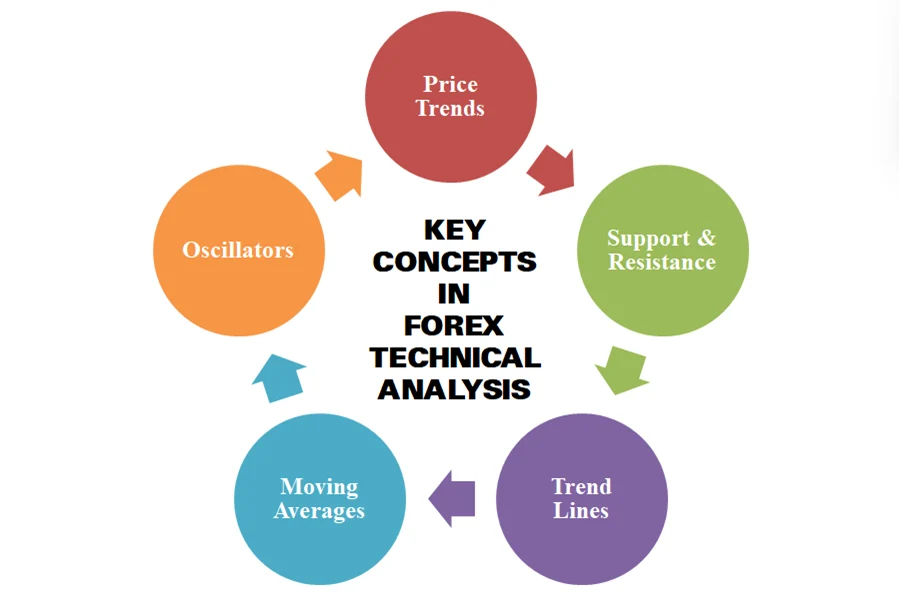
2.1. Price trends
A trend is how currency pairs move over time, such as EUR/USD, USD/JPY, or GBP/USD. It can go up (an uptrend), down (a downtrend), or sideways (a range). Trends are a big part of technical trading basics. If you know the trend, you'll be trading with the market, instead of against it.
2.2. Support & resistance
Support is a price level at which the market tends to stop falling, while resistance is where the market tends to stop rising. Traders who learn technical trading focus on such levels because they frequently indicate potential reversals or breakouts.
2.3. Trend lines
Trend lines are straight lines sketched on a chart to connect price highs and lows. Therefore, they provide direction for the market. Simple technical analysis often starts with trend lines because they're easy to sketch and are very useful.
2.4. Moving averages
A moving average displays the average price of a currency pair over a set period. It smooths out price swings and helps traders spot trends. This is a key tool when you’re figuring out how to use technical analysis to find buying or selling points.
2.5. Oscillators
Oscillators are indicators, such as RSI or MACD, that tell traders when a market will most probably be oversold or overbought. This means a market might reverse soon. If you have to define technical analysis tools in simple words, oscillators tell you when a price might reverse direction.
See more related articles:
3. How to read forex trading charts
Trading charts translate numbers into visuals, which help traders spot trends and patterns more easily. Different types of Forex trading charts have different ways to be read. Below are the 4 most common charts in forex technical analysis you need to know.

3.1. Line chart
The line chart is the simplest of them all. It is a straight line that connects the closing prices of a currency pair over time. It's perfect for anyone who wants a clean, no-clutter view of the market. Most people start with line charts when they first begin basic technical analysis.
3.2. Bar chart
A bar chart is more informative. Each bar represents the opening price, closing price, high price, and low price for a specific time. It helps one monitor daily ranges of prices and see potential reversals.
3.3. Mountain chart
Similar to a line chart, but mountain chart also includes the area below the line. This makes the chart just look like the shape of a mountain. It’s visually appealing and helps traders see price trends and changes over time at a glance.
3.4. Candlestick chart
The candlestick chart is the most popular tool in forex technical analysis. It displays the same data as a bar chart — high, low, close, and open prices — but more appealingly and colorfully. Each candle consists of a body and wicks (or shadows) that make it easy to spot price moves at a glance.
The thing that makes candlestick charts more useful is how they reflect market emotion. A green candle (or white) usually means buyers are in control, and a red (or black) one shows sellers pushing prices lower.
Hammer, Shooting Star, Doji, and Engulfing patterns are some of the most popular candlestick patterns traders use. If you are serious about learning technical analysis, candlestick charts are a must.
4. Benefits of using technical analysis
Technical analysis is not only a useful tool but also offers many practical benefits that help traders improve their trading effectiveness. Here are the key advantages of applying technical analysis in forex:
- Versatile and flexible: Technical analysis can be applied to various financial instruments and across all time frames, from intraday trading to long-term investing. It can be used for forex, stocks, commodities, and more.
- Objective and data-driven: Independent of forecasts or personal opinions, technical analysis relies on actual past price action, helping to minimize emotions and subjectivity in trading decisions.
- Effective entry and exit point identification: This tool helps you find the right timing to open or close positions, increasing the potential to optimize profits and limit risks.
- Understanding market movement characteristics: Markets often move in a zigzag pattern rather than straight lines. Technical analysis helps you capture these ups and downs to take advantage of trading opportunities within each wave.
- Detecting trend reversal signals: Through price patterns and indicators, you can identify early signs of market sentiment shifts and adjust your strategy in a timely manner.
- Easy to learn and suitable for beginners: With basic tools and models, technical analysis provides an intuitive and easy-to-understand approach for newcomers, helping build a solid foundation for developing trading skills.
Overall, technical analysis is a powerful tool that enables traders to effectively and proactively harness market movements. Understanding and applying technical analysis principles well not only supports accurate decision-making but also enhances risk management capabilities, contributing significantly to long-term success in forex trading.
5. What are the limitations of technical analysis
While forex technical analysis is a powerful tool for traders, it's not always perfect. Like other trading techniques, it has its limits.
- The market doesn’t always behave the same way: Technical analysis relies almost entirely on past price movements to predict what happens next. However, a big news event or a sudden shift in the economy can ruin chart patterns overnight.
- It may be overwhelming for beginners: There are too many indicators, patterns, and charts in technical analysis. And this can get you confused, especially for those who just jump into the market.
- No strategy works 100%: You will not win all the time for sure. Thus, risk management and patience are key. If you’re just starting, focus on simple technical analysis and avoid overloading your screen with too many indicators. Keep it clear, learn step by step, and practice regularly before trading live.
6. FAQs
6.1. How can I start to learn technical analysis?
You should start by learning the basics like price charts, resistance and support, and basic indicators. You may begin with free tutorials online, blogs on trading, or YouTube tutorials. Begin with basic technical analysis tools before moving to complex strategies. Practicing with a demo account is also a smart way to test your skills without risking real money.
6.2. Does technical analysis work in real trading?
Yes, many traders rely on technical analysis to make trading decisions. While not 100% accurate, it helps traders determine trends, possible reversals, and good entry or exit points. Keep in mind that technical trading fundamentals work best when combined with good money management and a calm mindset.
6.3. What are the most important technical analysis indicators for beginners?
The most widely used signs for beginners are Moving Averages, RSI (Relative Strength Index), MACD, and Bollinger Bands. They help traders read market patterns, measure price strength, and find possible points of reversal. Start with one or two and learn gradually to employ technical analysis with other tools as you gain experience.
7. Conclusion
Forex technical analysis is an essential tool that helps you better understand the forex market and improve your trading decision-making. While it cannot precisely predict every market movement, technical analysis provides valuable signals based on historical data and market behavior patterns. When combined with risk management and trading discipline, forex technical analysis becomes the key to optimizing profits and minimizing losses on your trading journey.
At H2T Finance, under our technical analysis category, we are committed to delivering accurate, easy-to-understand, and up-to-date knowledge to help you confidently apply technical analysis in your daily trading. Start your journey today and harness the power of technical analysis to become a successful trader.