For any trader, finding an entry point in the middle of a strong trend feels like the holy grail. Everyone wants in, but the fear of "buying the top" or "selling the bottom" is always present. This is where flag and pennant patterns truly shine.
They aren't magic, but they are reliable roadmaps on the price chart, telling us when a trend is likely just "taking a breather" before continuing its journey.
This guide will break down the structure, trading tactics, and real-world examples of the flag and pennant pattern to help you approach these opportunities with more confidence.
Key takeaways:
- Flag and pennant patterns are continuation signals that appear after strong price moves.
- Flags form as rectangular channels sloping slightly against the trend, while pennants compress into small symmetrical triangles.
- Both patterns indicate short consolidations before the prevailing trend resumes.
- Breakouts should be confirmed with volume surges to avoid false signals.
- Risk management involves using flagpole projections for targets and placing stop-loss just outside the consolidation.
- These setups are effective across Forex, stocks, commodities, and even crypto.
- Missteps include entering before breakouts, ignoring volume, or misidentifying reversal patterns.
1. What are flag and pennant patterns?
In technical analysis, flag and pennant patterns are considered highly dependable continuation signals.
They usually appear after a strong price movement, signaling a short consolidation before the prevailing trend resumes. Understanding these patterns is crucial for traders who follow trend-based strategies and want to identify high-probability trade setups.
These formations are common across various markets, including Forex, stocks, and commodities. Whether you're analyzing the EUR/USD pair or a tech stock like Apple, flag and pennant patterns can help you anticipate potential breakout points and plan your trades accordingly.
Read full more: What is a pennant?
1.1. The significance of flag and pennant patterns are valuable in trading
Flag and pennant patterns play a key role in trend-following trading methods. They help traders identify opportunities to join an ongoing trend following a short period of consolidation. While reversal patterns hint at a possible change in trend direction, continuation patterns like flags and pennants indicate that the existing trend is likely to carry on.
For instance, in a bullish trend, the price might surge upward (forming the flagpole), pause briefly (creating the flag or pennant), and then break out again in the same direction. This “rest and continuation” structure provides opportunities for traders to enter with momentum and minimize risk during consolidation phases.
1.2. Where these patterns appear in the market
You’ll frequently find the flags and pennants pattern on multiple timeframes, from intraday charts to weekly setups. They often appear:
-
After a strong breakout caused by major news or high volume
-
Ahead of the upcoming phase in a broader trend movement
-
In both bull and bear markets
Recognizing where these patterns form in the market structure is key to validating them and filtering out noise or false signals.
2. Anatomy of flag and pennant chart patterns
Before you can trade the pennant and flag pattern, you need to understand their structure. Both patterns share a common theme: a strong directional move followed by a pause, then a continuation in the same direction. However, their visual appearance and internal dynamics differ slightly, which can influence how traders interpret them.
Let’s break down the characteristics of each pattern to help you recognize them with confidence.
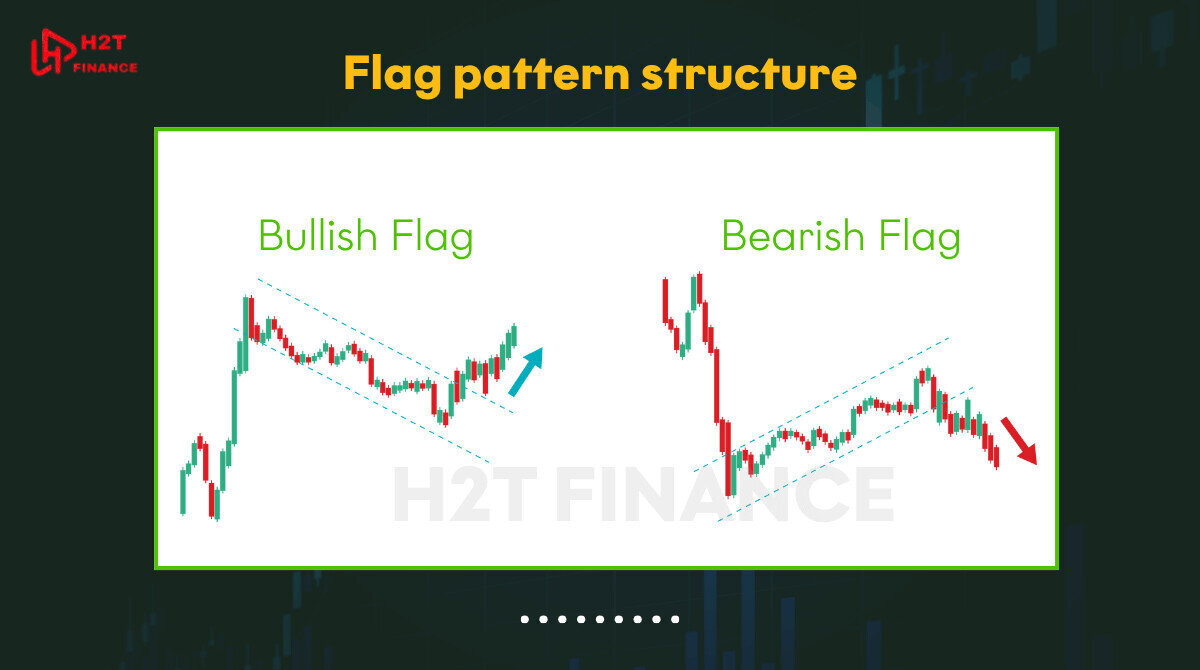
2.1. Flag pattern structure
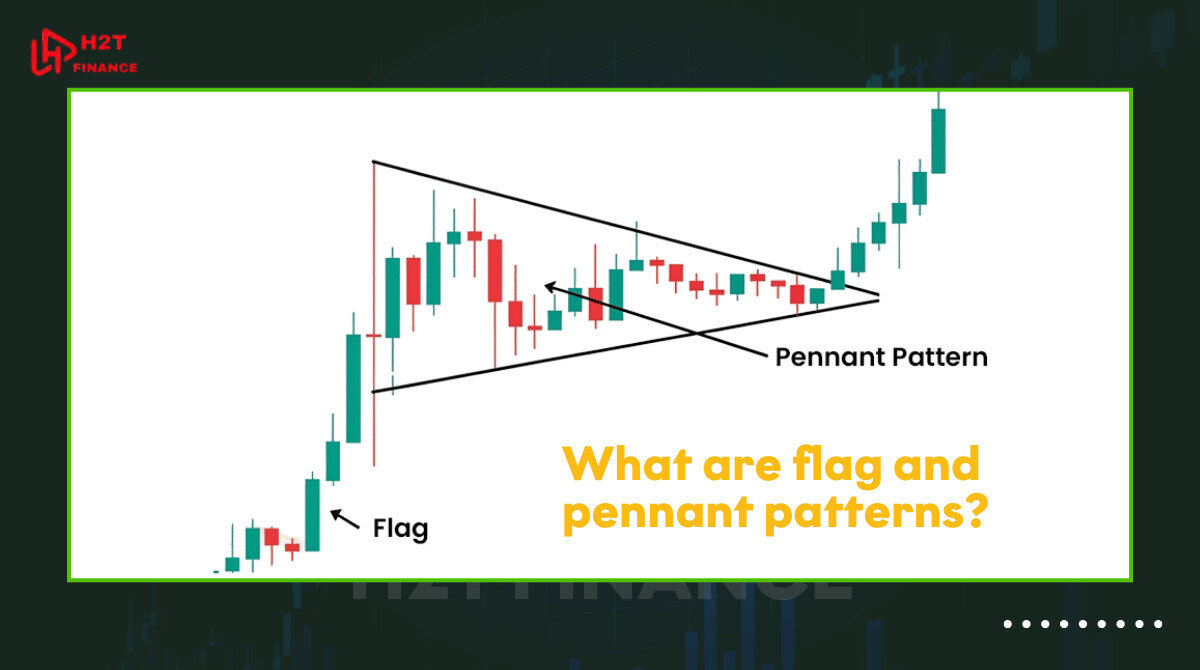
A flag pattern is formed after a sharp price movement, called the flagpole, which is then followed by a rectangular consolidation channel that slightly slopes against the trend. This pause resembles a flag on a pole hence the name.
-
Bullish flag: Occurs after a steep upward move. The consolidation slopes downward slightly.
-
Bearish flag: Appears after a sharp decline. The consolidation slopes upward slightly.
Despite the slope, the key trait of flag patterns is that the trendlines are parallel.
2.2. Pennant pattern structure
A pennant pattern also forms after a strong price move, but its consolidation phase differs. Instead of a rectangular shape, the price contracts into a small symmetrical triangle, where trendlines converge.
The most critical difference from a standard triangle pattern is the presence of a "flagpole" - a sharp price increase or decrease immediately preceding the consolidation.
Volume contracts during the consolidation, reflecting indecision or reduced participation. The breakout often occurs in the same direction as the initial move, supported by a volume surge. Unlike flags, pennants show converging trendlines, not parallel ones.
2.3. Comparison: flags vs. pennants
While both are continuation patterns, there are important differences in shape and structure that traders must identify accurately. Here’s a quick comparison:
| Feature | Flag Pattern | Pennant Pattern |
|---|---|---|
| Shape | Rectangular | Small symmetrical triangle |
| Trendline direction | Parallel | Converging |
| Consolidation slope | Slightly against trend | Neutral (horizontal or symmetrical) |
| Duration | Short to moderate | Typically shorter than a flag (from a few days to a few weeks, depending on the chart's timeframe) |
| Volume behavior | Declines during flag, surges on breakout | Declines inside pennant, spikes on breakout |
Understanding the structure of each flag and pennant pattern helps traders avoid confusion and increases the chances of identifying profitable breakouts with precision.
3. How to trade using flag and pennant patterns
Now that you can identify flag and pennant patterns, the next step is learning how to trade them effectively. These patterns offer traders an opportunity to join strong trends with defined risk and clear targets, making them highly practical for both swing and intraday trading strategies.
Trading a flag or pennant involves more than just recognizing the shape it requires careful attention to volume, entry timing, and risk management. Let’s explore each of these components in detail.
3.1. How to enter trades using flag and pennant patterns
The ideal time to enter a trade is when the price breaks out of the consolidation area, continuing in the direction of the preceding trend. Here's how to plan your entry:
-
In a bullish scenario, consider a long position once the price moves above the upper boundary of the flag or pennant.
-
In bearish setups, a short position can be taken when the price decisively breaks below the pattern’s lower trendline.
Traders often place buy stop or sell stop orders slightly above or below the pattern’s trendline to catch the breakout automatically.
3.2. Volume confirmation
Volume plays a critical role in validating flag and pennant patterns trading setups. A proper continuation breakout should be supported by an increase in volume. Here's what to watch:
-
During consolidation: Volume typically decreases, signaling market indecision.
-
At breakout: Volume should surge, confirming renewed interest and validating the breakout.
If the breakout occurs on weak volume, the pattern may fail or result in a false signal.
3.3. Setting targets and stop-loss levels
To manage risk and reward, traders need a clear exit plan. This is where measuring the flagpole becomes essential.
-
Target: Measure the length of the initial move (flagpole) and project it from the breakout point.
Example: If the flagpole is 100 pips, add 100 pips above the breakout for a bullish flag. -
Stop-loss: Place it just below the lowest point of the consolidation in a bullish setup (or above the highest point in a bearish setup).
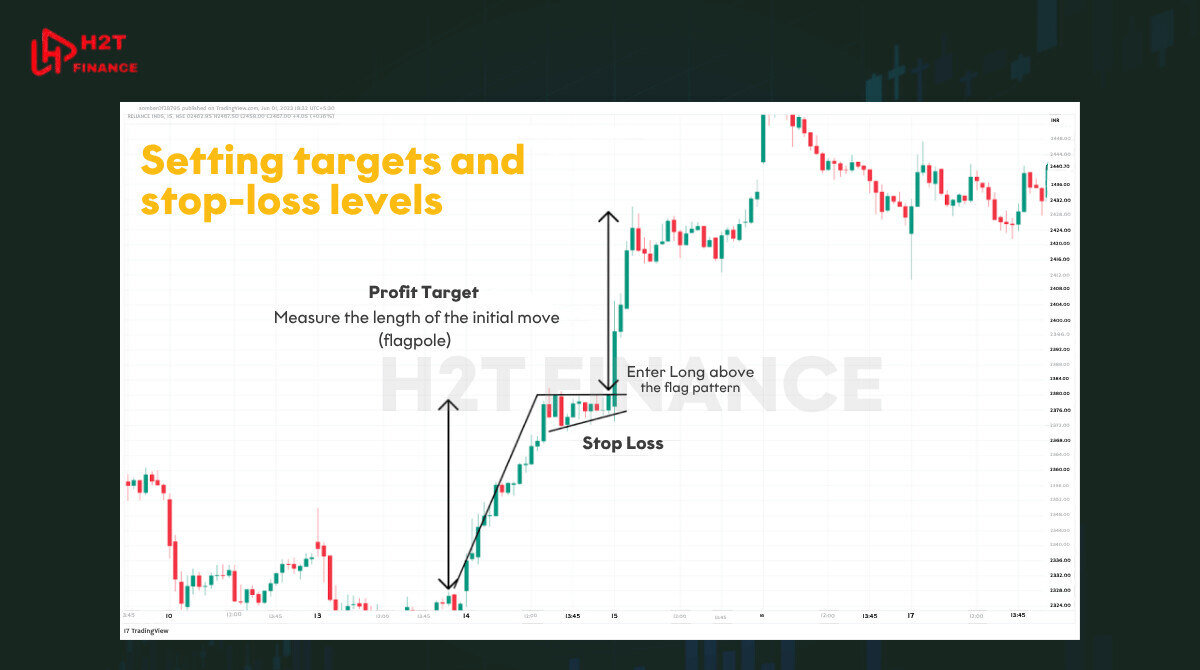
This method helps maintain a logical risk-reward ratio, ideally 1:2 or higher.
3.4. Example setup: flag and pennant patterns trading plan
Let’s consider a bullish pennant example:
-
Initial move: 1.1200 to 1.1300 (100 pips)
-
Consolidation zone: 1.1260–1.1285
-
Entry: Breakout above 1.1285
-
Target: 1.1385 (using the flagpole projection)
-
Stop-loss: 1.1255 (below the pennant)
This approach creates a well-structured plan with defined entries and exits, supporting disciplined trading.
When combined with confirmation tools like RSI, MACD, or trendlines, flag and pennant pattern stocks or forex trades can become highly effective components of a technical strategy.
4. Real examples: flag and pennant patterns in stocks and Forex
Seeing flag and pennant patterns in action is one of the best ways to internalize how they behave in live markets. These patterns are not just theoretical; they regularly appear in Forex, stocks, and commodities, offering practical opportunities for both short-term and swing traders.
Let’s walk through a few real-world examples to understand how these patterns unfold and what makes them reliable in various market contexts.
4.1. Bull flag on EUR/USD
One of the most classic flag and pennant pattern Forex examples is a bull flag formation on the EUR/USD currency pair, a key pair in forex exchange trading. After a sharp upward movement, the pair enters a brief down-sloping consolidation, forming a flag shape.
-
Initial rally: From 1.0800 to 1.0950
-
Flag consolidation: Slight retracement to 1.0900 with lower highs and lower lows
-
Breakout: Price surges past 1.0950 with strong volume, confirming the continuation
This setup offered a clean entry for trend followers, with the flagpole length providing a reliable price target.
4.2. Bear pennant on GBP/JPY
On the opposite side, GBP/JPY can exhibit a bearish pennant pattern following a strong downtrend:
-
Initial drop: From 183.00 to 180.00
-
Pennant phase: Tight consolidation between 180.30 and 180.80, forming a symmetrical triangle
-
Breakout: Price breaks below 180.00 with rising bearish volume
This pattern is typical in high-volatility pairs, where pennants signal a continuation of the selling pressure.
4.3. Stock market example: Nvidia (NVDA)
In stock trading, flag and pennant pattern stocks like Nvidia often display these patterns during earnings season or after news catalysts. For example:
-
Flagpole: NVDA rallies from $400 to $460 after a strong earnings report
-
Pennant: Tight triangle forms between $450 and $455
-
Breakout: Price clears $455 with heavy volume, resuming the uptrend toward $500+
Stock traders often use volume-based indicators like OBV or VWAP to confirm these breakouts.
Whether in Forex pairs or flag and pennant pattern stocks, these real examples prove how repeatable and tradable these continuation setups can be when used with a structured strategy and confirmation tools.
5. Difference between flag and pennant pattern
Although they both belong to the continuation pattern family, the flag and pennant patterns are structurally different. Understanding their distinctions is vital for accurate identification and execution. Misinterpreting one for the other can lead to false breakouts or missed opportunities.
Let’s explore what sets them apart in terms of shape, psychology, and trading implications.
5.1. Structural differences
| Feature | Flag Pattern | Pennant Pattern |
|---|---|---|
| Consolidation shape | Rectangular or parallel channel | Small symmetrical triangle |
| Trendline behavior | Parallel lines | Converging lines |
| Duration | Longer (several days to weeks) | Shorter (1–3 weeks or less) |
| Slope direction | Slopes against the trend | Horizontal or neutral |
| Appearance | Looks like a mini trend channel | Resembles a small wedge or triangle |
These structural elements are the foundation of how each pattern is interpreted. A flag has clean, parallel lines sloping against the trend, while a pennant compresses into a tighter, triangular range.
5.2. Psychological sentiment behind each pattern
Both patterns reflect a moment of indecision or profit-taking after a strong price move, but the market psychology differs slightly:
-
Flag: Think of it as an orderly "breather" for the market. The trend has had a long run and needs a rest. Early participants take some profit, but conviction in the main trend remains, so there is no panic selling.
-
Pennant: This is more like a tightly coiled spring. Both buyers and sellers are digging in their heels, and pressure builds in an ever-tighter space. An explosive release of energy in one direction feels almost inevitable.
Understanding this emotional backdrop can improve timing and avoid premature entries during the consolidation.
5.3. When to use each in technical analysis
Knowing the difference between flag and pennant pattern setups also helps in choosing the right strategy:
-
Use flags in trending markets where the pullback is orderly and shallow.
-
Use pennants when the consolidation is tight and symmetrical often indicating an imminent breakout.
Both patterns work well when paired with confirmation indicators (e.g., RSI divergence, MACD crossovers, or a spike in volume).
By correctly identifying and distinguishing these flags and pennants chart patterns, traders can increase their accuracy and confidence when entering momentum trades.
6. Best tools to spot flag and pennant patterns
Identifying flag and pennant chart patterns manually can be rewarding, but using the right tools significantly increases accuracy and efficiency especially in fast-moving markets like Forex and stocks. Traders often rely on platforms and indicators to visually confirm pattern formation, analyze volume behavior, and test strategies.
Let’s look at the best charting platforms and resources to recognize and trade these flags and pennants patterns effectively.
6.1. TradingView, MT4, and MT5: pattern recognition tools
6.1.1. TradingView
-
Offers highly customizable charts with drawing tools to mark flag and pennant patterns trading setups.
-
Community scripts and indicators (like pattern recognition tools) allow users to automate identification of common chart patterns.
-
Clean, web-based interface with built-in backtesting and real-time alerts.
Best for: Pattern discovery, visual clarity, multi-timeframe analysis.
6.1.2. MetaTrader 4 (MT4)
-
While MT4 doesn't natively detect chart patterns, traders can install custom indicators or use manual drawing tools to mark consolidation zones.
-
Lightweight and ideal for execution, especially in Forex.
Best for: Traders who prefer a lightweight terminal with price action focus.
6.1.3. MetaTrader 5 (MT5)
-
Offers more advanced charting than MT4 with deeper backtesting features and more built-in indicators.
-
Supports multiple asset classes ideal if you trade both Forex and flag and pennant pattern stocks.
Best for: Strategy testing and multi-asset traders.
6.2. Free indicators and scripts
Many free tools are available across platforms to enhance detection:
-
Auto Chart Patterns (TradingView) – highlights breakout points with adjustable sensitivity
-
Pattern Recognition Master (MT4/MT5) – identifies pennants, flags, wedges, and more
-
Volume Spike Indicators – useful for breakout confirmation in both patterns
These tools help eliminate bias and provide consistency in spotting valid setups.
6.3. Backtesting strategies with tools
Before applying any flag and pennant pattern trading strategy live, it’s critical to test it:
-
Use TradingView’s Bar Replay or MT5’s Strategy Tester to simulate pattern outcomes
-
Backtest on major pairs like EUR/USD, USD/JPY, or trending stocks like Tesla or Nvidia
-
Include criteria such as volume breakout, pattern duration, and risk/reward ratios
Backtesting enhances your confidence and filters out low-probability patterns in real-time trading.
7. Limitations and common mistakes when using these patterns
While flag and pennant patterns are powerful tools in technical analysis, no strategy is foolproof. Misinterpreting these patterns or ignoring key confirmations can lead to losses especially in fast-paced markets like Forex and stocks.
Understanding the limitations and common pitfalls will help you apply these patterns more effectively in your trading strategy.
7.1. Entering before the breakout
A common mistake is jumping in too early, assuming a breakout will occur. However, until price clearly breaks above or below the pattern with supporting volume, the setup remains incomplete.
-
Why it's risky: The market may remain in consolidation or even reverse.
-
What to do: Wait for a valid breakout candle that closes beyond the trendline with volume confirmation.
7.2. Ignoring volume behavior
Volume plays a key role in the credibility of flags and pennants chart patterns. Many traders overlook this:
-
During consolidation: Volume should taper off.
-
At breakout: Volume should increase significantly.
Ignoring these volume cues may lead to false signals or failed breakouts.
7.3. Misidentifying reversal patterns
It’s easy to confuse flags and pennants chart patterns with patterns that can signal a reversal. For example, a flag pattern might be mistaken for a wedge pattern, a potential reversal signal.
The key difference is: a flag typically slopes against the main trend (e.g., a downward-sloping flag in an uptrend), whereas a reversal wedge often slopes in the same direction as the trend before breaking out the other way. To avoid this, always look at the broader trend context and use confirmation indicators like MACD, RSI, or moving averages.
7.4. Neglecting news or macro factors
Patterns may fail due to external shocks such as:
-
Major economic releases (e.g., NFP, CPI)
-
Central bank announcements
-
Geopolitical tensions
Even a textbook flag and pennant pattern stock setup can break down if market sentiment changes rapidly. That’s why it’s important to combine technical and fundamental awareness.
7.5. Not confirming across timeframes
Traders often make decisions based on a single timeframe, ignoring the bigger picture. A flag on a 15-minute chart may be part of a bearish trend on the 4-hour chart.
Tip: Always cross-check patterns on at least two timeframes before placing trades.
By recognizing these pitfalls, traders can refine how they use flags and pennants pattern strategies and build more resilient trading plans that adapt to both market conditions and technical context.
Pro tip: Don't just review your winning trades. Open your journal and find the flags and pennants pattern trades that failed. Why did they fail? Was it unexpected news? Weak volume? Did you mistake it for another pattern? The answers from these failures are often more valuable than the profits from the wins.
Expand your knowledge with these topics:
- CME What Does It Stand For? Quick Guide for Traders
- Elegant oscillator indicator formula: How it works & how to use
- How to trade the Forex market: Strategies & tools explained
8. Frequently asked questions (FAQs)
8.1. What is the difference between a flag and pennant pattern?
The key difference lies in the shape of the consolidation:
-
Flag pattern: Features parallel trendlines forming a rectangle or a slight channel that slopes against the prevailing trend.
-
Pennant pattern: Has converging trendlines that form a small symmetrical triangle, showing a tighter, more compact consolidation.
Both are continuation patterns, but flags tend to last longer and are more linear, while pennants are shorter and more compressed.
8.2. Is a pennant pattern bullish or bearish?
A pennant pattern can be bullish or bearish, depending on the direction of the initial price movement (the flagpole):
-
If the flagpole is upward, the pattern is a bullish pennant.
-
If the flagpole is downward, it’s a bearish pennant.
The breakout usually continues in the direction of the flagpole, not against it.
8.3. Is a flag pattern bullish or bearish?
Just like pennants, flag patterns can be either:
-
Bullish flag: Forms during an uptrend and signals a continuation higher.
-
Bearish flag: Forms during a downtrend and signals a continuation lower.
Both types are common in Forex and flag and pennant pattern stocks.
8.4. Can flag and pennant patterns be used in day trading?
Yes, both patterns are effective in day trading, especially on lower timeframes like 5-minute or 15-minute charts. However, confirmation through volume and momentum indicators is even more critical at these faster speeds to avoid false breakouts.
8.5. Do these patterns work in crypto or commodities?
Absolutely. Flags and pennants trading techniques are applicable to all liquid markets, including:
-
Cryptocurrencies (e.g., Bitcoin, Ethereum)
-
Commodities (e.g., Gold, Oil)
-
Indices and ETFs
As long as price action is driven by crowd psychology, these patterns remain valid.
8.6. Which is more reliable: flag or pennant?
Both patterns are statistically reliable, but flags tend to occur more frequently and are easier to identify due to their clearer structure. Pennants, being more compact, can offer faster breakouts but may require greater precision in execution.
8.7. What is the difference between a flag pattern and a pennant pattern?
A flag is a rectangular consolidation with parallel trendlines sloping slightly against the trend, while a pennant is a small symmetrical triangle with converging trendlines. Both signal continuation but differ in structure and duration.
8.8. Is a pennant flag bullish or bearish?
A pennant can be either bullish or bearish. If it follows an upward flagpole, it’s bullish; if it follows a downward flagpole, it’s bearish. The breakout usually continues in the direction of the pole.
8.9. Are flag patterns profitable?
Flag patterns can be profitable when traded with confirmation signals such as volume spikes and risk management rules. They are widely used by trend-following traders for identifying high-probability continuation setups.
8.10. Is flag pattern bullish or bearish?
A flag pattern may be bullish or bearish depending on the trend it follows. A bullish flag forms during an uptrend and signals further upside, while a bearish flag forms in a downtrend and suggests continued downside.
9. Final thoughts: Should you use flag and pennant patterns in your strategy?
So, should you use flag and pennant patterns in your strategy? Absolutely. But the key to success isn't just in spotting the shape. It's in the patience to wait for a volume-confirmed breakout, the discipline to manage risk with a tight stop-loss and a worthy profit target, and the wisdom to combine them with indicators like MACD or RSI.
Honing your skill in trading flag and pennant patterns is a journey, and that's exactly what we at H2T Finance aim to support. To continue elevating your skills, we invite you to explore our guides in the Forex Basics category. Start trading smarter today!