In the fast-paced world of Forex trading, where every pip counts, tools that bring clarity to market trends are invaluable. Imagine having a way to not only visualize the dominant direction of price movement but also pinpoint potential reversal zones with statistical precision. That’s exactly what a regression channel offers.
For serious traders, mastering how to draw regrassion channel indicator for MT4 is a foundational skill. It doesn't just provide a data-driven method to navigate the complexities of the Forex market; it builds the confidence to make decisions in a volatile market. Whether you’re a trend-follower or a mean-reversion trader, this tool transforms raw price data into actionable insights.
Let’s dive into how regression channels can elevate your technical analysis and why MetaTrader 4 (MT4) is the perfect platform to harness their potential.
1. What does a regression channel represent in forex trading?
Understanding how to draw regrassion channel indicator for MT4 starts with a solid grasp of what a regression channel actually is and how it fits into Forex technical analysis. As a trend-based tool, the regression channel can offer traders a statistically grounded way to interpret market direction and potential reversal points.
1.1. Definition of a regression channel
A regression channel is a technical analysis tool that applies linear regression to price data, creating a trendline that best fits the overall direction of the market. This line is calculated to reduce the gap between it and the actual price movements, offering a statistically balanced view of the trend.
In simpler terms, the regression line represents the equilibrium price or the statistical centerline of price movement over a chosen period.
The regression line is accompanied by two equidistant parallel lines referred to as the upper and lower channel limits that frame the price movement. These are typically set at a fixed number of standard deviations above and below the regression line, creating a visual boundary that represents probable overbought and oversold zones.
1.2. Main elements: central regression line, and the channel’s upper and lower boundaries
Each regression channel consists of three main elements:
- Regression line: This is the midpoint line derived from linear regression, representing the average direction or trend of price movements over a defined period.
- Upper channel line: Placed above the regression line, typically at +1 or +2 standard deviations, signaling a potential overbought level.
- Lower channel line: Positioned an equal distance beneath the regression line, it signals areas where the price may be considered oversold.
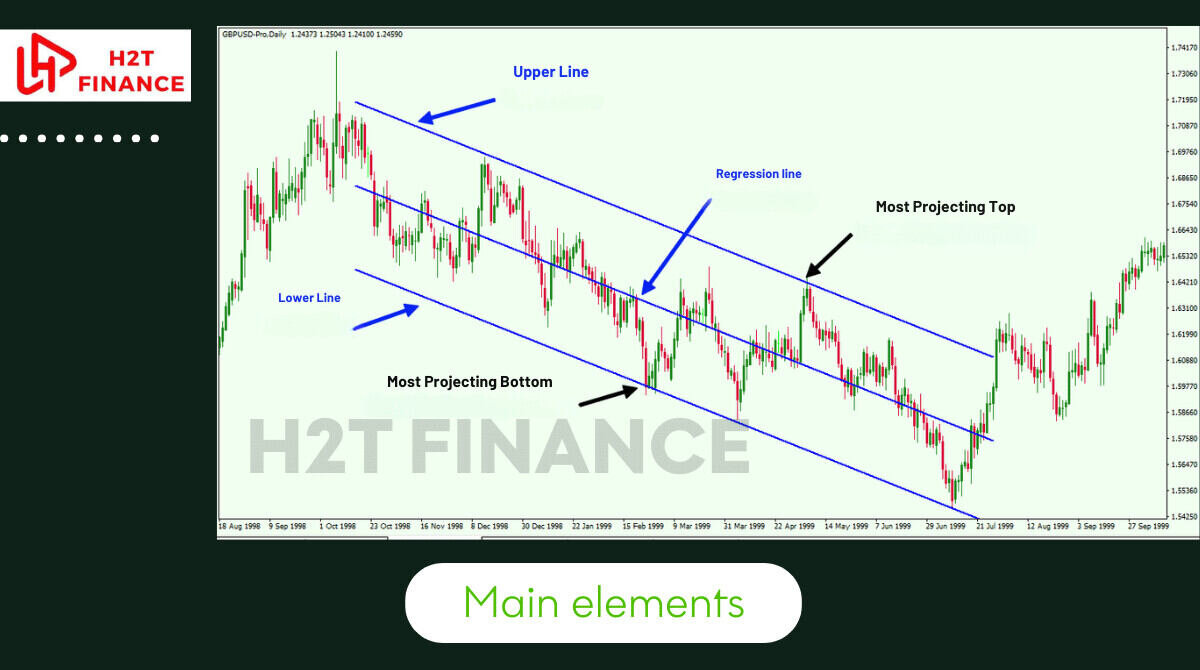
These boundaries can help traders anticipate when price may revert back toward the mean.
1.3. How it differs from trendlines and Bollinger Bands
While regression channels may visually resemble trendlines or Bollinger Bands, their structure and calculation are quite distinct:
| Feature | Regression Channel | Trendline | Bollinger Bands |
|---|---|---|---|
| Based on math? | Yes, uses linear regression | No, drawn manually | Yes, based on moving averages + stdev |
| Upper/Lower band | Set by standard deviation | Not applicable | Calculated around moving average |
| Auto-adapting | Semi-automatic (indicator-based) | Manual | Automatic |
Regression channels provide a statistically grounded visualization of price movement, which trendlines often lack due to their subjectivity. Meanwhile, Bollinger Bands adapt to volatility but center around a moving average, not a regression line.
1.4. When and why traders use it
Regression channels are particularly useful for the following trading purposes:
- Trend confirmation: Helps determine whether price is moving within a defined direction over time.
- Mean reversion: Traders often anticipate that price will return to the central regression line after touching the upper or lower bands.
- Swing trading: Helps identify key turning points and areas of interest for entries and exits.
- Support and resistance: The channel lines act as dynamic levels that price may respect, break, or retest.
From my experience, after testing various tools, the regression channel consistently stands out. It replaces the subjective guesswork of drawing simple trendlines with a clear statistical framework something quantitative traders actively seek.
2. Why use regression channels in MT4?
Now that you understand what a regression channel is, the next question is why you should use it specifically within MetaTrader 4 (MT4). MT4 remains one of the most widely used trading platforms in the Forex world, and its support for regression channels both manually and via custom indicators makes it a powerful tool for identifying price dynamics with precision.
2.1. Helps define the prevailing trend with precision
Unlike basic trendlines that rely heavily on trader interpretation, regression channels use statistical methods to define the central path of price movement. This makes them especially useful when you want to analyze the overall trend without subjective bias. In MT4, you can apply the regression tool to a selected period and immediately see whether price is trending up, down, or moving sideways.
Applying the regression channel indicator in MT4 allows traders to smooth out small price variations and focus more clearly on the overall market direction.
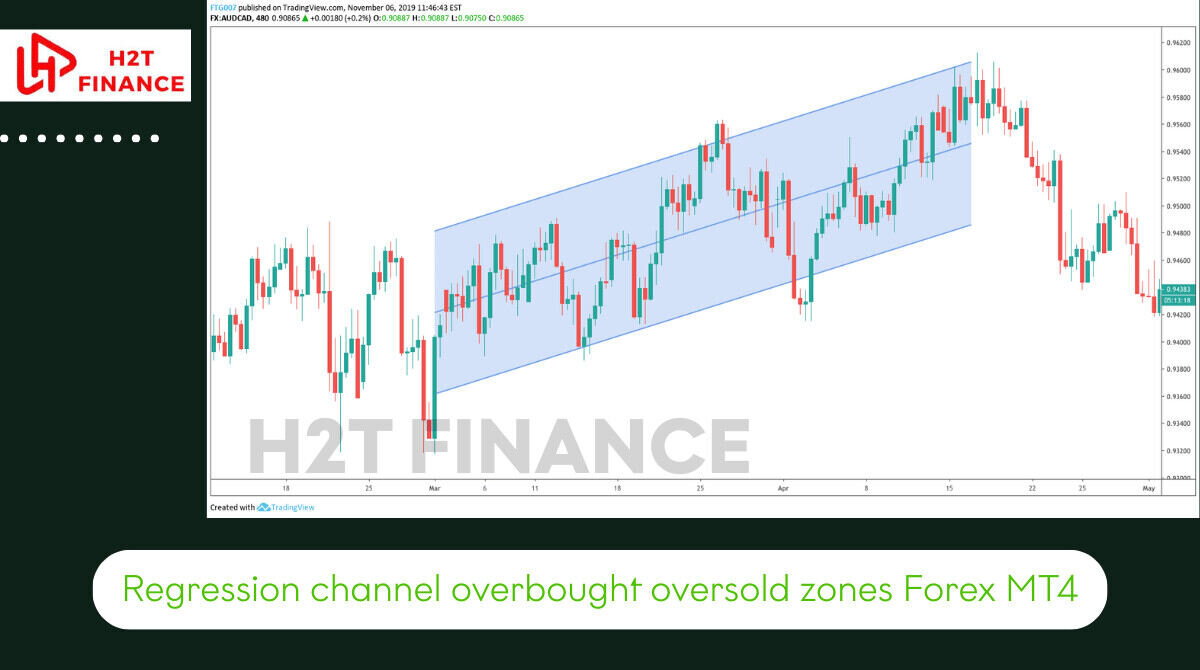
2.2. Visual guide to overbought and oversold zones
The top and bottom boundaries of the regression channel assist traders in spotting areas where price reversals might occur. When price reaches the upper boundary, it might indicate an overbought condition, while the lower boundary may suggest oversold pressure. These zones are not guarantees, but they provide valuable context especially when combined with other indicators like RSI or MACD.
This makes the regression channel a reliable guide for setting up counter-trend trades or scaling out of positions.
2.3. Great for identifying pullback entries
Trend-following traders often rely on pullbacks to enter at better prices. The central regression line can act as a dynamic “value zone” where price frequently returns after a move toward the outer bands. This behavior aligns well with classic trading strategies that seek to “buy the dip” in an uptrend or “sell the rally” in a downtrend.
In MT4, once you've draw regrassion channel indicator for MT4 across a trending section, you’ll often see price retrace back to the regression line before continuing. Recognizing this behavior allows for more calculated entries.
2.4. Easy integration with trend-following or reversal strategies
Whether you're a trend trader or prefer mean reversion, the regression channel adapts to multiple strategies. It doesn't just map the current trend it also gives visual cues for volatility and potential breakout pressure. When price repeatedly tests the channel edges, for example, it could signal a potential breakout setup.
3. How to draw regrassion channel indicator for MT4 (manual method)
MetaTrader 4 offers a built-in tool to draw regrassion channel indicator for MT4 manually without needing any external downloads. This feature is especially useful for traders who want quick access to trend-based visual tools. Although it’s not fully automated, the manual method gives you full control over which part of the price chart you want to analyze.
Before diving into the steps for draw regrassion channel indicator for MT4, it’s important to understand the key components that make up this technical tool:
- Central Line: This is the core of the regression channel, also known as the regression line. It represents the best-fit line calculated using linear regression, showing the average direction of price movement over a selected period. The central line acts as a dynamic reference point, indicating the trend’s midpoint where price tends to revert during balanced market conditions.
- Upper Boundary Line: This line is drawn parallel to the central line, typically positioned at a set number of standard deviations (e.g., +1 or +2) above it. It marks the upper limit of the channel and often signals overbought conditions when price approaches or crosses it, suggesting potential reversals or pullbacks.
- Lower Boundary Line: Positioned an equal distance below the central line, this parallel line is typically set at a negative standard deviation (e.g., -1 or -2). It indicates oversold conditions when price nears or breaches it, highlighting areas where price may rebound or stabilize.
Understanding these terms will help you better interpret the regression channel and apply it effectively in your trading analysis.
Below is a step-by-step guide to help you draw regrassion channel indicator for MT4 using its default tools.
Step-by-step guide to draw regrassion channel indicator for MT4:
Before starting, make sure your MT4 platform is open and that you have your desired currency pair chart loaded.
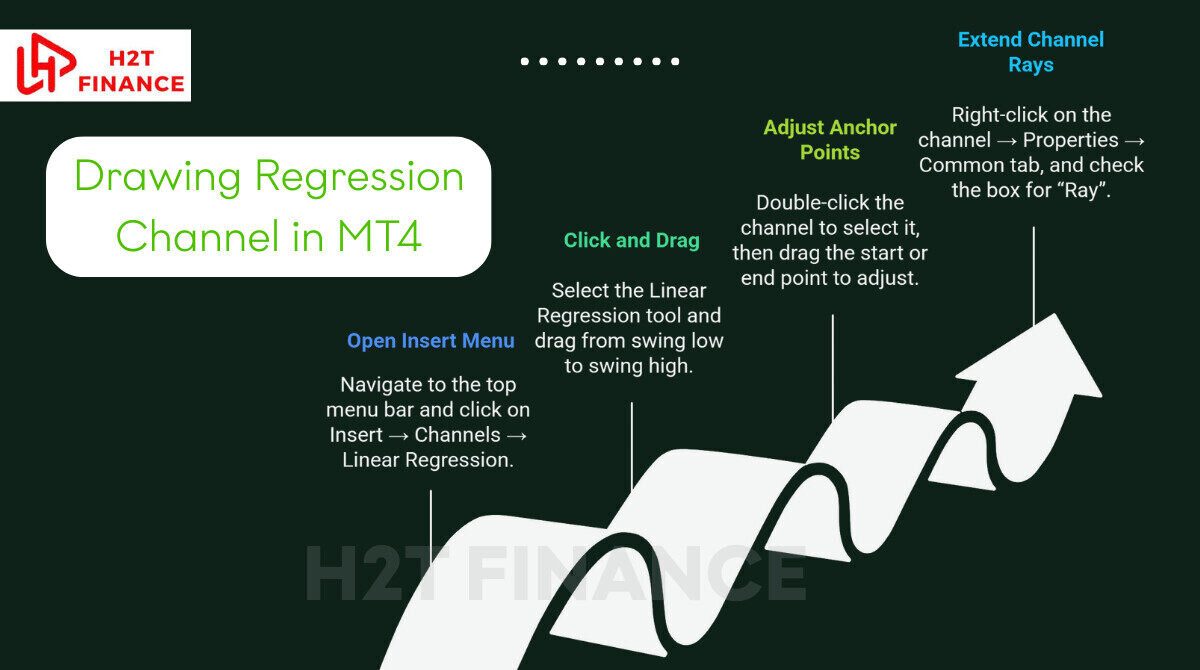
3.1. Open the Insert menu
Navigate to the top menu bar and click on Insert → Channels → Linear Regression. This is where the manual regression tool is located.
3.2. Click and drag from swing low to swing high
After selecting the Linear Regression tool, move your mouse to the starting point (for example, a swing low in an uptrend or swing high in a downtrend).
Then click and drag the mouse to the ending point of the price section you want to analyze. MT4 will automatically generate the regression line along with the parallel upper and lower channels.
3.3. Adjust anchor points if necessary
If the initial placement doesn't align perfectly with your intended price zone, you can double-click the channel to select it, then drag the start or end point to adjust the anchor. This flexibility is helpful when fine-tuning your technical analysis.
3.4. Extend the channel rays
Right-click on the channel → Properties → Common tab, and check the box for “Ray” to extend the channel into the future. This makes it easier to forecast how price might behave relative to the current trend structure.
3.5. Limitations of the built-in regression channel tool
While the MT4 default regression channel tool is useful, it has several limitations:
- It does not auto-update as price moves, meaning you'll need to redraw it if the trend evolves.
- The channel width is fixed, based on the initial draw, and doesn’t adjust dynamically.
- There are no built-in alerts or advanced settings like some custom indicators offer.
Despite these drawbacks, this manual method still provides a fast and accessible way to incorporate regression analysis into your trading workflow.
4. How to interpret a regression channel in MT4
Mastering the use of regression channels in MetaTrader 4 (MT4) can give traders a clearer view of market dynamics. This technical tool doesn’t just show where price has been—it helps you visualize trend direction, potential turning points, and key zones of support or resistance. Here's how to interpret it effectively.
4.1. Understanding price behavior within the channel
A regression channel is made up of three lines: the central regression line, which represents the best-fit average price path, and two parallel lines above and below it that mark potential zones of price deviation.
- Middle line (Regression line): This serves as a trend baseline. When price hugs this line, it often indicates equilibrium that neither bulls nor bears are in control.
- Upper channel line: If price nears or breaches this area, it may reflect an overbought market. Caution is warranted, as a pullback or correction could follow.
- Lower channel line: Movement toward this zone often implies oversold conditions, where price might stabilize or rebound.
Regression channels don’t forecast precise turning points, but they highlight zones where reversals frequently occur.
Consistent price action within the channel implies trend health. However, if price repeatedly closes outside the boundaries, especially for prolonged periods, it may be signaling weakening momentum or an impending trend change.
4.2. Spotting trends and reversals
One of the primary uses of regression channels is to visualize the prevailing trend and detect shifts in market direction:
- Upward-Sloping Channel: Suggests a bullish trend. Price tends to climb, respecting the channel limits.
- Downward-Sloping Channel: Indicates a bearish environment, with price generally declining within the bands.
- Flat Channel: Implies sideways movement—common during periods of market indecision or consolidation.
A strong trend is usually confirmed when price bounces off the median line and continues in the direction of the slope. This behavior offers potential re-entry points during pullbacks.
However, breaks outside the channel boundaries can have two meanings:
- Break above upper line: Could indicate bullish continuation, but might also warn of overextension.
- Break below lower line: May suggest bearish continuation, or that the market is oversold and due for a rebound.
Extended closes outside a regression channel often precede market reversals, watch them closely.
To use regression channels effectively in MT4, observe how price behaves relative to each line in the channel. Is it trending or ranging? Is it respecting the boundaries or breaking through them?
For greater accuracy, consider combining regression channels with other technical tools like the RSI, MACD, or moving averages. This confluence of signals will give you a stronger foundation for trade entries, exits, and overall trend confirmation.
5. Using a regression channel indicator for MT4 (automatic method)
While drawing regression channels manually in MT4 can be helpful, many traders prefer using custom indicators that automate the process. These tools not only save time but also eliminate the need to constantly redraw the channel as price evolves. If you're aiming for more accuracy and convenience, using an automatic regression channel indicator in MT4 is the better choice.
Below, we’ll walk through how to install and use a third-party regression channel indicator in MT4.
5.1. Introduction to custom regression indicators in MT4
A custom regression channel indicator for MT4 automatically plots the central regression line and its associated channel boundaries. Unlike the manual method, it can update dynamically as new candles form making it highly practical for real-time trend analysis, breakout detection, or automated alerts.
Popular versions of these indicators often include customizable settings such as:
- Channel width (based on standard deviations or custom multipliers)
- Color and line style
- Option to display multiple channels on the same chart
- Auto-refreshing behavior
5.2. How to install a third-party regression channel indicator in MT4
Installing a regression channel indicator in MT4 involves just a few simple steps. Make sure you’ve downloaded the indicator file, which usually comes in .mq4 or .ex4 format.
Step-by-step installation guide:
- Download the indicator file: Locate a trusted source. Save the .mq4 or .ex4 file to your computer.
- Open the MT4 data folder: In MT4, go to File > Open Data Folder. This opens the directory where your platform stores its scripts and indicators.
- Paste the indicator into the correct folder: Navigate to MQL4 > Indicators, then copy and paste the downloaded file into this folder.
- Restart MT4: Close and reopen MT4 to allow the new indicator to load.
- Add the indicator to your chart: In the Navigator panel, expand the “Indicators” section, then drag the newly installed regression channel onto your chart.
5.3. Settings and customization tips
Once installed, most regression channel indicators offer a settings window where you can:
- Choose the period (e.g., last 100 candles)
- Set the channel width (e.g., 1.5 standard deviations)
- Change line colors, thickness, and styles
- Enable or disable price alerts when touching the outer bands
Customize these settings to fit your strategy. For example, swing traders may prefer wider channels, while scalpers might opt for tighter boundaries.
5.4. Pros and cons compared to manual drawing
| Feature | Manual Drawing | Custom Indicator |
|---|---|---|
| Auto-refresh | No | Yes |
| Visual customization | Limited | Extensive |
| Alerts | No | Often included |
| Setup speed | Slower | Instant |
| Ideal for real-time trading | Not suitable | Highly recommended |
Frankly, switching to an automatic regression channel indicator in MT4 is a real game-changer. During high-volatility sessions, it frees you from the cognitive burden of constantly redrawing the channel, allowing you to focus entirely on executing your strategy.
6. Practical trading strategies using regression channels
Once you've learned how to draw regrassion channel indicator for MT4 either manually or with a custom tool the next step is applying it effectively in your trading. Regression channels are not just for visual appeal; they provide a logical framework for various trading strategies across timeframes and market conditions.
In this section, we’ll explore how to use regression channels for trend-following, mean reversion, and breakout setups along with useful indicators to combine for higher accuracy.
6.1. Trend-following strategy: enter on pullbacks to the regression line
In an uptrend, the regression channel's central line often acts as a dynamic support level. When price pulls back toward this line, it may present a buying opportunity especially if confirmed by bullish candlestick patterns or volume spikes. The reverse is true in downtrends.
Example approach:
- Wait for price to retrace to the regression line.
- Look for a bullish engulfing candle or a bounce in volume.
- Place a stop below the lower channel line for protection.
This setup helps you enter at a “fair value” point rather than chasing extended moves.
6.2. Mean reversion: trade rebounds from upper/lower bands
Mean reversion traders use the outer bands of the regression channel as dynamic overbought/oversold zones. When price touches or breaks outside the bands and quickly reverses, it may signal a short-term trading opportunity.
This approach works well in ranging or weakly trending markets and can be enhanced with oscillators like RSI or Stochastic.
Example entry conditions:
- Price touches upper channel in a range-bound market.
- RSI is above 70 (overbought).
- Look for reversal confirmation and consider short positions.
6.3. Channel breakout: confirmation from volume or candlestick patterns
A strong move beyond the channel especially with volume expansion can signal the start of a new trend or trend acceleration. These breakouts are powerful when supported by macroeconomic catalysts or news events.
Tips for breakout setups:
- Confirm with a closing candle outside the channel.
- Volume should be higher than average.
- Use lower timeframe retests for entry confirmation.
6.4. Confluence with RSI or moving averages
Combining regression channels with complementary indicators adds strength to your analysis. For example:
- RSI: Helps confirm overbought/oversold zones inside the channel.
- Moving Averages: Confirm trend direction and dynamic support/resistance.
You can also overlay Fibonacci retracements to find areas of confluence between technical levels.
6.5. Sample strategy table
| Strategy | Entry Signal | Stop Loss Location | Target Profit |
|---|---|---|---|
| Trend-following | Pullback to regression line + volume spike | Below lower channel | Upper channel or swing high |
| Mean reversion | Price rejection at channel edge + RSI extreme | Above/below recent wick | Midline or opposite channel |
| Breakout | Candle closes outside channel + high volume | Below/above breakout candle | 2x risk or trailing stop |
7. Common mistakes and tips when using regression channels
While the regression channel indicator in MT4 can be a powerful analytical tool, it’s not immune to misuse. Many traders especially those new to technical analysis make avoidable mistakes that reduce the effectiveness of this indicator. In this section, we’ll explore common pitfalls and offer practical tips to help you make better trading decisions.
7.1. Drawing from incorrect reference points
One of the most frequent mistakes is drawing the regression channel using inappropriate anchor points. For example, using wicks instead of candle bodies or selecting a price range that doesn't reflect the dominant market trend can distort the results.
Tip:
Always choose a well-defined trend segment. Use swing lows and highs that represent real market structure, not noise.
7.2. Using regression channels on low-volume or sideways markets
Regression channels are most effective in trending environments. Applying them to flat or illiquid markets can lead to misleading signals, as the standard deviation boundaries may not provide meaningful support or resistance.
Tip:
Before draw regrassion channel indicator for MT4, assess whether the market is trending or ranging. If in doubt, confirm with a moving average crossover or ADX indicator.
7.3. Ignoring timeframe relevance
Some traders apply regression channels without considering the timeframe they’re working on. For instance, a channel that looks valid on the 15-minute chart may not align with the broader trend on the 1-hour or daily chart.
Tip:
Use multi-timeframe analysis to ensure your regression channel is aligned with the overall market context. Draw the primary channel on a higher timeframe (e.g., 4H), then look for entries on a lower one (e.g., 30M).
8. MT4 vs MT5 vs TradingView: Which is best for regression channels?
Choosing the right platform can significantly impact how you draw and use regression channel indicators. While MetaTrader 4 (MT4) remains a favorite among Forex traders, its successors and competitors MT5 and TradingView offer distinct features that may suit different trading styles.
In this section, we’ll compare MT4, MT5, and TradingView based on their support for regression channels, customizability, and user experience.
8.1. Built-in support for regression tools
- MT4: Includes a basic manual linear regression tool (Insert → Channels → Linear Regression). While functional, it lacks auto-refresh and advanced settings unless supplemented with custom indicators.
- MT5: Offers similar native functionality as MT4 but with slight UI improvements. It also has strong support for custom indicators.
- TradingView: Provides a highly customizable regression trend tool (under “Regression Trend”) with auto-updating features and advanced visualization out of the box.
If your priority is real-time adaptability and ease of drawing, TradingView offers the smoothest built-in experience.
8.2. Custom indicator availability
- MT4: Has the largest library of free and paid custom regression channel indicators due to its long-standing community. Tools like TFLab’s indicator or EarnForex’s versions are popular.
- MT5: While MT4 historically has a larger repository, the MQL5 community (for MT5) has grown exceptionally strong. Today, MT5 offers a rich and high-quality library of custom indicators, sometimes even surpassing the older tools on MT4. Finding an effective regression channel indicator on MT5 is now straightforward.
- TradingView: Supports Pine Script-based customizations, though user-generated tools may be locked behind paywalls or require subscription access.
Traders who want freedom to experiment with dozens of regression channel variations may prefer MT4.
8.3. Ease of use and visual clarity
- MT4/MT5: Interface is more functional than modern. Drawing tools are basic but sufficient for traders who value low system resource usage and execution speed.
- TradingView: Offers a modern, clean UI with drag-and-drop drawing, multi-device sync, and web-based convenience.
Visual learners or those conducting in-depth chart analysis across multiple markets may find TradingView more intuitive.
8.4. Platform comparison table
| Feature | MT4 | MT5 | TradingView |
|---|---|---|---|
| Built-in regression tool | Manual only | Manual only | Auto + manual |
| Custom indicator availability | Extensive | Extensive | Varies (depends on plan) |
| Ease of use | Moderate | Slightly improved | Excellent |
| Visual customization | Limited | Limited | Advanced |
| Best for | EA users, scalpers | Multi-asset traders | Visual traders, strategists |
8.5. Recommendation
If you want maximum flexibility with free tools and expert advisor (EA) support, MT4 remains the top choice especially when enhanced by custom regression indicators. However, if you prioritize sleek visuals, mobile access, and auto-refresh features, TradingView might better suit your workflow.
From my perspective, MT4 hits the right balance for Forex-focused traders who value function over form, while TradingView is ideal for multi-market technical analysts.
Learn more from our expert resources:
- Japanese candlestick colors meaning: Easy Forex guide
- MT4 MT5 trading software forex ratings & strategy guide
- Flag and pennant patterns in trading: A complete guide
9. FAQs about regression channels in MT4
Many Forex traders especially those new to regression tools have specific questions about how regression channels work within MetaTrader 4. In this section, we’ll answer frequently asked questions to clear up confusion and help you use the indicator with confidence.
These answers are crafted to target People Also Ask (PAA) boxes and featured snippets for stronger SEO visibility.
9.1. Can I download a free regression channel indicator for MT4?
Yes. Several developers provide free regression channel indicators for MT4.
9.2. Is regression channel available by default in MT4?
Yes, MT4 includes a built-in manual regression channel drawing tool. You can find it by navigating to Insert > Channels > Linear Regression. However, this version does not update automatically as new price data comes in; it's static unless manually adjusted.
9.3. What’s the difference between a regression channel and a trendline?
A trendline is manually drawn and typically connects swing highs or swing lows to represent trend direction. In contrast, a regression channel is based on statistical analysis, using linear regression to find the average trend and plotting equidistant upper and lower bounds.
| Feature | Regression Channel | Trendline |
|---|---|---|
| Calculation basis | Linear regression (math-based) | Manual placement |
| Includes deviation | Yes (upper/lower channel lines) | No |
| Auto-updating | Only with custom indicators | No |
| Use case | Quantitative trend + volatility zones | Visual trend direction |
9.4. Does MT4 automatically update regression channels?
No, the default MT4 regression channel does not auto-refresh. It remains fixed unless you manually adjust the anchor points. However, many custom regression indicators do auto-update, making them more suitable for real-time strategy execution.
10. Final thoughts: Should You Use Regression Channels in MT4?
Mastering how to draw regrassion channel indicator for MT4 can be a game-changer for technical traders seeking clarity in the chaotic Forex market. This statistically grounded tool offers a unique blend of trend identification, volatility analysis, and precise entry/exit signals, making it a versatile addition to any trader’s toolkit.
Key benefits for technical traders:
- Trend clarity: Pinpoint the market’s direction with a mathematically driven regression line.
- Dynamic zones: Identify overbought and oversold areas for smarter trade setups.
- Versatile strategies: Supports trend-following, mean-reversion, and breakout trading.
- MT4 compatibility: Seamlessly integrates with MT4’s robust platform for manual or automated use.
Who should consider using it?
Regression channels are ideal for traders who value data-driven insights over subjective guesswork. Whether you’re a beginner exploring or an experienced trader refining your edge, this tool suits scalpers, swing traders, and long-term strategists alike.
Therefore, if you are a trader looking to capitalize on trending markets or seek pullback entry opportunities, mastering how to draw regrassion channel indicator for MT4 is not just an option, it's a strategic move to sharpen your competitive edge.
Are you ready to turn this knowledge into a real edge? Don’t just stop at reading. Open your MT4 platform now, apply what you’ve just learned, and begin your journey to conquer the market with data-driven confidence. Explore more advanced tools in our Forex Basics series at H2T Finance to keep growing.