To be honest, learning Doji candlestick patterns felt like a total mess when we first started. We’d see that tiny body, the long wicks a clear tug-of-war but then we’d jump into trades way too early, only to get stopped out. It took us a while to really understand that a single Doji means little on its own; context is everything.
You’ll see why traders ask “is a Doji candlestick bullish or bearish?” and why the real answer begins with location, trend, support/resistance, and volume. We’ll keep the Doji candlestick meaning simple, show where it earns your attention, and where it’s just market noise.
Key takeaways:
- Doji candlestick patterns represent market indecision, where buyers and sellers balance each other.
- Main variations include Standard, Long-legged, Dragonfly, Gravestone, and Four-price Doji.
- Context matters: Doji at support or resistance is more meaningful than one in the middle of a range.
- A Doji alone is not a trading signal; confirmation with indicators, volume, or other candlestick reversal signals is essential.
- Pros: simple to spot, versatile across markets, helpful for timing exits or alerts.
- Cons: frequent false signals, high dependence on context, and risk of overtrading.
- Real chart examples in forex and crypto show Doji as warning signs, not guarantees.
1. What is a Doji candlestick? Key things you need to know
Before we dive into the advanced setups, let’s pause and face a common question: what exactly is a Doji candlestick, and why do traders care so much about it? When we first saw a Doji on our charts, we honestly felt stuck.
It looked like the market was frozen, neither pushing up nor falling down. Later, we realized that this “pause” can speak volumes about crowd psychology if you read it in the right context.
1.1. What is a Doji candle?
In candlestick basics, a Doji appears when the opening and closing prices are nearly identical. This tiny or nonexistent body, combined with upper and lower wicks, makes it resemble a cross or plus sign. In simple terms, a Doji is an indecision candle, showing that neither buyers nor sellers managed to dominate during that period. if you’re new, see japanese candlestick colors meaning to read candle colors correctly.
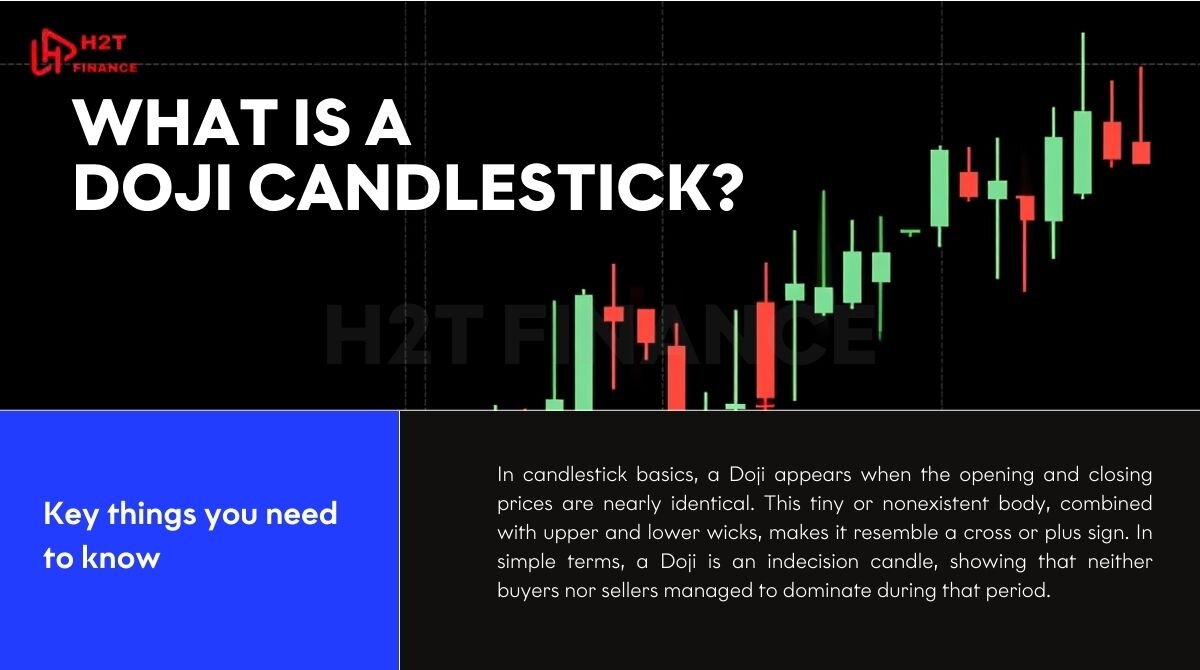
On live charts, this often feels like the market catching its breath, a moment where both sides step back to rethink their next move.
1.2. The origin of the concept
The word Doji comes from the Japanese language, meaning "same thing," a name that perfectly encapsulates its essence: a delicate balance between opening and closing prices.
What started as an elegant tool for 18th-century rice traders in Sakata, Japan, to grasp the nuances of supply and demand, has since blossomed into something truly remarkable.
In the 1990s, when Steve Nison unveiled these patterns to Western traders, it was a pivotal moment. He didn't just introduce a new charting technique; he unlocked a new language for the markets.
Since then, the Doji has grown from a simple line on a chart to a powerful, universally recognized symbol of market introspection and potential change in markets from forex and stocks to the exhilarating world of crypto.
1.3. Why is Doji important in trading?
The biggest mistake we've seen new traders make? Treating every Doji as a guaranteed reversal signal. This gets to the heart of Why is Doji important in trading? It's not a signal to act, but a signal to pause and think. A Doji at strong support or resistance can be a valuable warning. But one that pops up in the middle of a sideways chop is often just market noise.
For us, the real value of Doji candlestick meaning in forex or stocks lies in its role as a signal to pay attention, not to act blindly. It reminds you to slow down, confirm, and only then consider your entry; if you’re new, read how does forex trading work for the big picture.
Key points:
- A Doji forms when open and close prices are almost the same, creating a cross-like shape.
- It reflects indecision, earning the nickname “indecision candle.”
- The term “Doji” comes from Japanese, and candlestick charts were later popularized by Steve Nison.
- A Doji can hint at a reversal, but only when read with trend, support/resistance, and confirmation tools.
2. Understanding Doji candles. How to recognize them and their variations
When we first tried to identify Doji candlesticks on live charts, the challenge was real. Some candles looked like Doji, but when measured carefully, they turned out to be spinning tops or simply weak candles.
Learning the structure and types of Doji candlestick patterns saved us from those mistakes and gave us confidence to read the market with more clarity.
2.1. The structure of a Doji
At its core, a Doji has an extremely small body because the open and close prices are nearly equal. The candle often resembles a cross, a plus sign, or even a T-shaped figure, depending on the length of the shadows.
This tiny body signals hesitation the crowd tried to push in both directions, but in the end, no side won. That’s why traders also call it an indecision candle.
2.2. Main variations of Doji candlesticks
Each type of Doji has its own story about buyer and seller sentiment. Below are the most common variations you’ll see in practice:
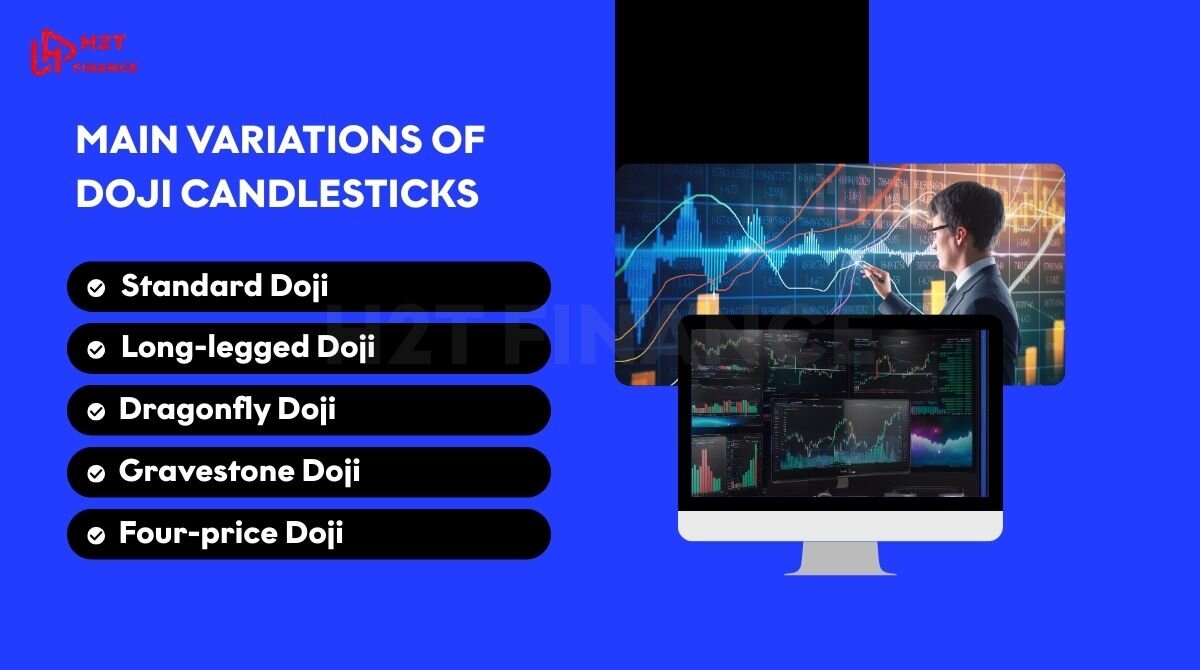
- Standard Doji: A classic cross with balanced upper and lower shadows, showing a neutral standoff. It usually means the market is pausing after a move.
- Long-legged Doji: With long upper and lower shadows, it reflects strong pushes from both sides, but no final winner. This often appears in volatile sessions and can hint at a trend losing strength.
- Dragonfly Doji: Here, the open and close are at the top of the range, leaving a long lower shadow. The dragonfly Doji meaning is simple: sellers pushed the price down, but buyers came back fiercely, often suggesting potential bullish reversal.
- Gravestone Doji: Opposite to the dragonfly, the open and close rest near the lows, leaving a long upper shadow. The gravestone Doji meaning is that buyers tried to drive the price up but failed, giving sellers the upper hand commonly seen before bearish reversals.
- Four-price Doji: Rare and unusual, all four price points (open, high, low, close) are the same, leaving only a flat line. This pattern screams extreme indecision, usually in low-liquidity markets.
While each type looks different, they all share one message: buyers and sellers are in balance; when the market shifts into a continuation pattern like pennant, a Doji’s meaning changes and often aligns with continuation rather than reversal.
2.3. Comparing Doji with spinning tops and regular candles
In our early trading days, we confused spinning tops with Doji candle patterns more times than we can count. The key difference is the body size: a Doji’s body is nearly invisible, while a spinning top has a slightly larger one. Both signal weakness in the current trend, but never assume they guarantee a reversal.
Compared to standard candles with clear bullish or bearish bodies, Doji and spinning tops are much more about hesitation than momentum. Recognizing this distinction prevents overtrading and reminds us to seek confirmation from tools like volume or Bollinger Bands before acting.
3. The psychology behind each Doji
Every candle tells a story, and the Doji is no exception. Its real power is not in the shape itself but in the emotional tug-of-war it represents. From our experience, the more we looked at Doji candles, the more we realized they were mirrors of hesitation, a battle where no side truly wins. This doji psychology helps us step into the mindset of buyers and sellers before making a decision.
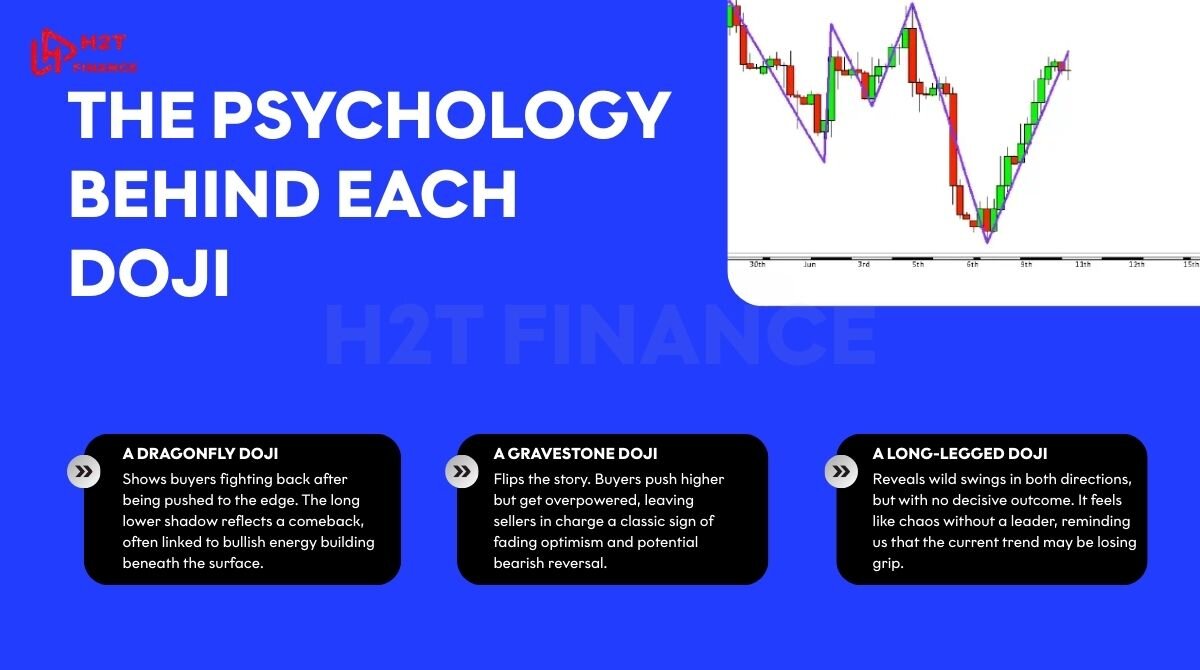
When a Doji appears, the first message is equilibrium. Buyers and sellers push hard, yet prices close near where they started. This standoff signals an indecision market, often the first hint that momentum is slowing down. If it comes after a strong run, the market may be whispering that exhaustion is near.
Each variation adds its own nuance:
- A dragonfly Doji shows buyers fighting back after being pushed to the edge. The long lower shadow reflects a comeback, often linked to bullish energy building beneath the surface.
- A gravestone Doji flips the story. Buyers push higher but get overpowered, leaving sellers in charge a classic sign of fading optimism and potential bearish reversal.
- A long-legged Doji reveals wild swings in both directions, but with no decisive outcome. It feels like chaos without a leader, reminding us that the current trend may be losing grip.
The truth we learned the hard way: a Doji is rarely a direct buy or sell signal. It is a warning sign, a yellow light urging you to slow down, wait for confirmation, and read the broader picture before committing your capital.
Doji candlesticks embody the struggle between bulls and bears, highlighting hesitation at key moments. They don’t give you certainty, but when placed in the right context, these candlestick reversal signals can be the difference between walking into a trap and spotting a real shift in sentiment.
4. How to use Doji in trading strategies
A Doji on the chart is like a whisper; it doesn't scream “buy” or “sell,” but it urges you to pay attention. Over time, we’ve learned that the best way to use Doji candlestick forex signals is by combining them with context, tools, and discipline. A solid Doji trading strategy never treats the pattern as a shortcut but as a piece of a larger puzzle.
4.1. Spotting the Doji pattern
The first step is simple but requires focus: find a candle with almost no body, where the open and close are nearly identical. On a busy chart, this might feel like searching for a needle in a haystack, but once your eyes adjust, Dojis stand out. We remember countless late nights squinting at screens before this shape finally became second nature to us.
4.2. Assessing the market context
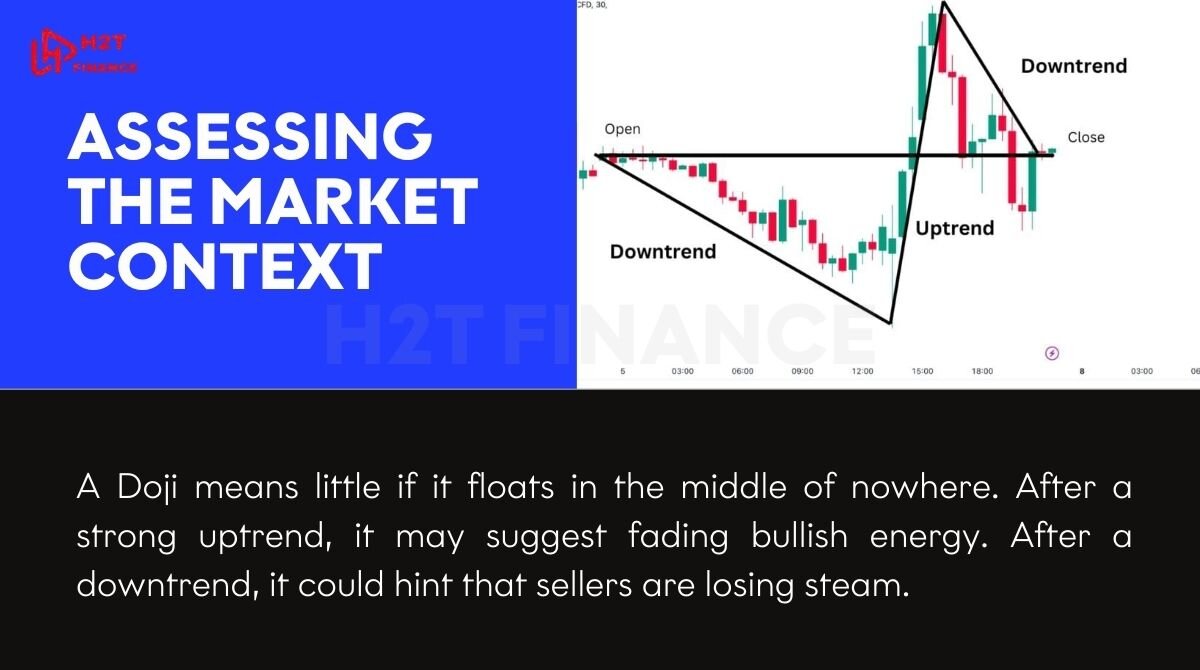
A Doji means little if it floats in the middle of nowhere. After a strong uptrend, it may suggest fading bullish energy. After a downtrend, it could hint that sellers are losing steam. The strongest signals we’ve seen came when a Doji formed right at a clear support or resistance level moments where the market seems to hold its breath.
4.3. Confirming with other indicators
Here’s a lesson we learned the hard way: trading on a Doji alone is the fastest way to burn your account on false signals. That’s why Doji confirmation is non-negotiable.
Think of tools like RSI, moving averages, or trendlines as the gatekeepers for your trade. For instance, one of our cleanest short entries came from a Doji candlestick pattern bearish at resistance, confirmed by RSI divergence. Without that confirmation, we simply treat it as noise and move on.
4.4. Watching trading volume
Volume is like the heartbeat behind a candle. A Doji with unusually high volume shows a genuine clash between bulls and bears, making the signal stronger. On the other hand, a Doji on thin volume can be deceptive, often just background chatter. We’ve avoided plenty of bad trades by respecting this difference.
4.5. Setting entry and exit points
Once confirmed, the next step is structure. Define where to enter, where to cut losses, and where to take profits. For a bearish setup, entries might sit just below the Doji’s low; for a bullish setup, just above the high.
We always set stop-loss orders near the opposite wick to avoid unnecessary pain. Over time, this discipline turned impulsive reactions into controlled trades.
4.6. Combining with other patterns
Doji candles rarely travel alone. They gain more weight when paired with other formations like a Morning Star with a Doji at the bottom of a downtrend, or an Evening Star with a Doji at the top of an uptrend. These combos add layers of confirmation and make the trade plan more reliable.
A Doji is a signpost, not a destination. It alerts us to pause, analyze, and seek backup evidence before risking capital. When blended with volume, indicators, and context, Doji candlestick forex setups can turn hesitation into opportunity, reminding us that patience and confirmation are the real edge in trading.
5. Pros and cons of Doji candles
When we first built strategies around Doji candle patterns, the excitement was real. Spotting a clear cross on the chart felt like uncovering a hidden clue in the market. Over time, though, we learned that these signals come with both strengths and limitations.
Let’s break down the advantages and disadvantages we’ve experienced when using them.
5.1. Advantages
Doji candles offer several benefits that make them a favorite tool among traders:

- Easy to spot: Their small body and cross-like look make them simple to recognize, even on a busy Doji candle pattern chart.
- Versatile in all markets: Doji can appear in uptrends, downtrends, or consolidation, giving insight no matter the condition.
- Momentum warning: After a strong move, such as a rally or selloff, a Doji often signals that momentum is slowing. This makes it useful for planning exits or preparing for potential reversals.
- Works with confirmation: When combined with indicators like RSI, moving averages, or Fibonacci, Doji becomes far more reliable and less noisy.
- Valuable educational tool: For beginners, recognizing a Doji helps build the foundation for reading market psychology and preparing for more complex patterns.
5.2. Disadvantages
Despite its strengths, the Doji also has weak spots that can lead to costly mistakes if ignored:
- Indecision, not certainty: A Doji reflects hesitation, not direction. This means it can signal a reversal or simply continuation. Without confirmation, it’s ambiguous.
- False signals in volatility: In fast-moving markets, Doji show up often, especially Long legged Doji candles. Many of these are misleading, as the market may continue its path regardless.
- Dependence on context: A Doji at resistance can hint at a bearish Doji candlestick pattern, while the same shape in the middle of nowhere may be meaningless.
- Requires patience: Using Doji effectively means waiting for backup evidence. Traders who jump in on the first bullish Doji candlestick they see often regret the rush.
- Overconfidence trap: Because the Doji candlestick meaning seems simple, we see too many new traders bet the farm on it. They spot a Doji and jump in, only to find that without a full plan, the signal fails more often than it helps.
Doji candles are both a gift and a trap. They are simple to read and widely applicable, but on their own, they don’t hand out reliable trades. We’ve found the best results come when treating them as caution flags strong when confirmed, dangerous when traded blindly.
6. Common mistakes when analyzing Doji
When we started out, we thought every Doji was a golden ticket. Looking back, that belief cost us trades, time, and plenty of sleepless nights. To save you from the same frustration, here are the most frequent candlestick mistakes traders make with Doji, and the Doji trading risks that come with them.
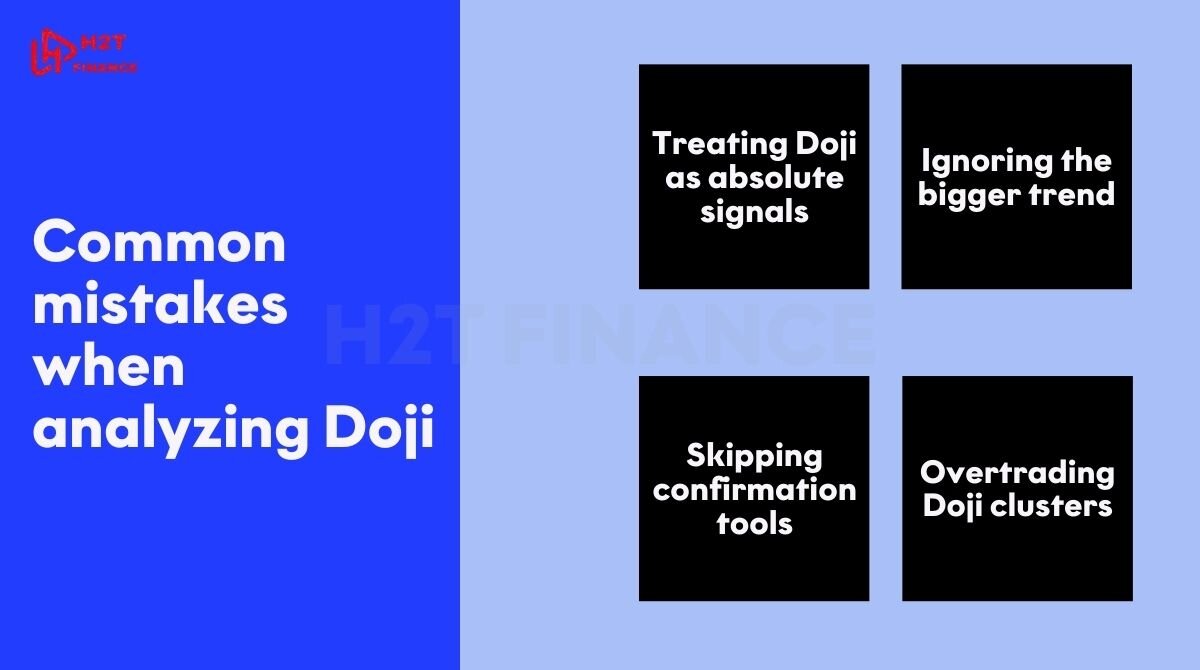
- Treating Doji as absolute signals: Many beginners jump into positions the moment a Doji appears, assuming it guarantees a reversal. In reality, a Doji is more of a yellow light that warns you to slow down, not speed up.
- Ignoring the bigger trend: A Doji inside a strong bull market doesn’t hold the same weight as one at the top of a rally. Forgetting the context often leads to trades that fight the main direction of price.
- Skipping confirmation tools: Trusting Doji without volume, RSI, or moving averages to confirm is like betting blindfolded. We learned this the hard way confirmation separates real opportunities from noise.
- Overtrading Doji clusters: Seeing multiple Dojis in a row tempts traders to take action again and again. But often, this just signals choppy indecision, not an edge. Falling into this trap drains both capital and patience.
Misreading Doji is less about the pattern itself and more about the trader’s impatience. Respect the context, demand confirmation, and you’ll avoid the traps that turn a helpful signal into an expensive lesson.
7. Real-world examples on charts
Reading theory is useful, but nothing hits harder than seeing Doji candles play out on actual charts. Over the years, we’ve tested setups across forex, crypto, and stocks. Some trades turned into solid wins; others reminded us that context and confirmation matter more than any single candle. Let’s walk through a few scenarios to bring the lessons to life.
7.1. Doji at resistance in forex
On the EUR/USD daily chart, the pair had been climbing steadily, pushing into a major resistance near 1.1050. Right at that level, a clear Doji formed a small body, long shadows, exactly the kind of Doji chart example that gets traders excited. Volume spiked at the same time, hinting that buyers were running into a wall.
When price slipped below the Doji low the next day, it confirmed a bearish shift. Those who shorted with stops above the high caught a smooth decline. It was a textbook forex candlestick example of how Doji signals hesitation at critical levels.
7.2. Doji at support in forex
On GBP/USD, the story was the opposite. After a heavy downtrend, the pair touched a long-term support near 1.3000. A Doji appeared with long wicks, showing a fierce struggle. Volume was strong, suggesting that sellers might be exhausting their momentum.
Traders who waited for a break above the Doji high saw the pair rally in the following sessions. It wasn’t instant, but the bounce reinforced how Doji near support can mark the turning point when combined with confirmation.
7.3. Case study: Doji with RSI confirmation
One of our most memorable trades involved a Dragonfly Doji on Bitcoin’s 4-hour chart. It printed after a sharp drop, sitting right on a support zone. On its own, we might have ignored it. But RSI was showing bullish divergence price made new lows while RSI held higher.
That double signal gave us confidence to enter long above the Doji high. The move that followed was explosive, rewarding patience and reminding us that confirmation transforms an “indecision candle” into a powerful setup.
These examples prove a crucial point: Doji candles don’t predict the future on their own. But when they appear at key levels, supported by volume or indicators, they become high-value signals. Whether bearish at resistance or bullish at support, context and confirmation turn a simple cross on the chart into a practical trading edge.
See more articles in this category:
8. FAQs
8.1. Is Doji bullish or bearish?
A Doji itself is neutral. It can be bullish at support or bearish at resistance, depending on market context.
8.2. What happens after a Doji?
After a Doji, price may reverse or continue the trend. The outcome depends on trend strength, levels, and confirmation signals.
8.3. How to confirm Doji candle?
Use volume spikes, RSI divergence, moving averages, or a breakout beyond the Doji’s high/low to confirm its signal.
8.4. What is the 3 Doji pattern?
The 3 Doji pattern is a rare sequence of three consecutive Doji candles, showing extreme indecision and often signaling a strong breakout ahead.
8.5. How can a Doji be used in cryptocurrency trading?
In crypto, Doji works like in forex or stocks best at key levels, with confirmation. They help spot pauses in volatile moves and prepare for reversals or breakouts.
9. Conclusion & next steps
In the end, Doji candlestick patterns remind us of one thing above all: hesitation. They capture moments when neither buyers nor sellers win, creating powerful clues about potential change. But a Doji is never a stand-alone answer; it must be combined with context, volume, and other signals to avoid false confidence.
For beginners, learning to recognize Doji is the first step toward building discipline. For experienced traders, it serves as a timely reminder to slow down, wait for confirmation, and only act when the market aligns with your plan.
At H2T Finance, we believe trading gets easier when you treat patterns as tools, not predictions. If you want to sharpen your edge, continue exploring our Forex Strategies section where you’ll find more setups that, when combined with Doji, can transform uncertainty into opportunity.


