If you've ever felt overwhelmed by trading charts that look like a mess of chaotic lines, we completely understand. But the truth is, hidden within that randomness are repeatable patterns that reveal golden opportunities.
For a day trader, recognizing these signals in a matter of seconds can determine the difference between a winning and a losing trade. That's why a day trading chart patterns pdf becomes an indispensable companion, helping you recognize key setups, stay focused, and trade with more confidence.
Key takeaways:
- A day trading chart patterns pdf is a compact guide that helps traders recognize setups faster and trade with more confidence.
- The most common patterns fall into two groups: continuation (flags, pennants, triangles, rectangles) and reversal (head & shoulders, double tops/bottoms, wedges).
- Practical examples, like a double top in stocks or a bullish flag in forex, show how to apply theory in real trades.
- Chart patterns work best when combined with other tools such as RSI, MACD, and price action, rather than used alone.
- To learn chart patterns fast, focus on 5–7 core setups, use your PDF like flashcards, practice on live charts, and keep a trading journal.
- Chart patterns are powerful but not a holy grail; consistency comes from blending them with solid risk management and complete strategies.
1. What are day trading chart patterns and why are they important?
Before diving into strategies, it’s worth asking: what exactly are chart patterns in trading? At the simplest level, they are recognizable shapes that appear on price charts, waves, peaks, or consolidations that tell a story about market behavior.
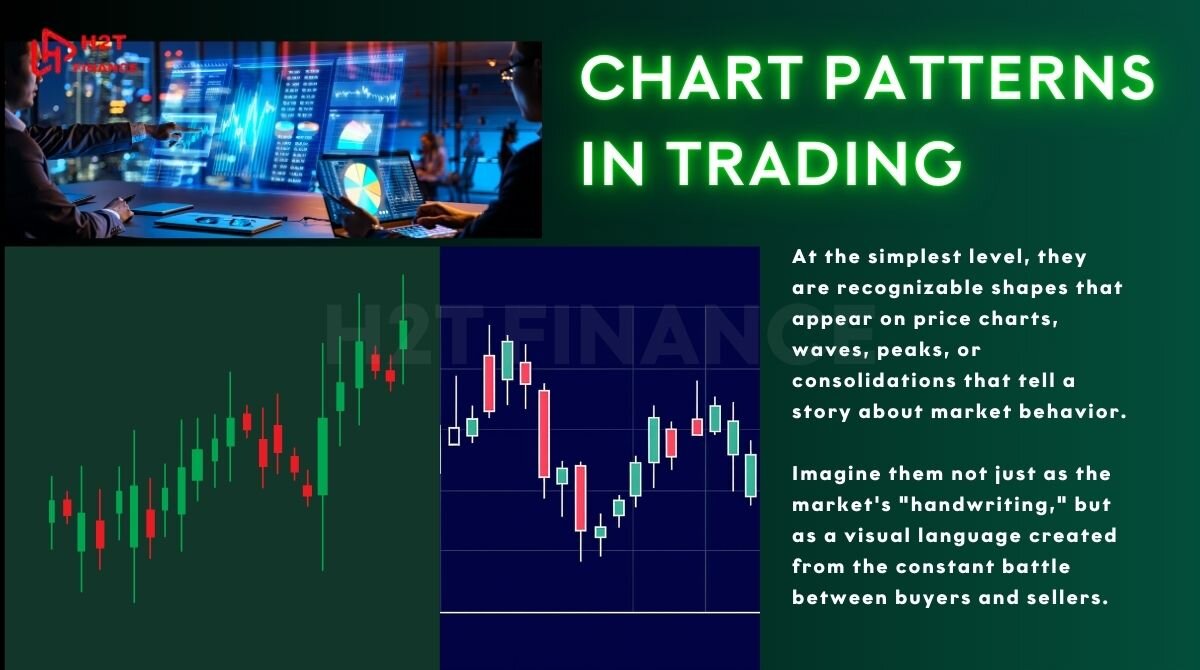
Imagine them not just as the market's "handwriting," but as a visual language created from the constant battle between buyers and sellers. Each pattern is more than just a shape; it tells the story of greed, fear, and opportunity, leaving behind clear clues about where the price is headed next. This is the art of How to read chart patterns in day trading, a skill that transforms confusing charts into a roadmap to profit.
1.1. A simple explanation of chart patterns in trading
A chart pattern is like a visual signal. When you see a triangle forming, it often suggests the market is pausing before deciding its next move. A head and shoulders pattern, on the other hand, can hint at a possible reversal.
These aren’t just random shapes; they are footprints of trader psychology repeated across timeframes. That’s why day trading chart patterns become such a vital part of technical analysis.
1.2. Why they matter for day traders
For day traders, decisions must be quick and precise. Unlike long-term investors, you don’t have weeks to wait for confirmation. Recognizing a pattern in real time can help you spot entry and exit points within minutes.
A simple double top can alert you to exit before a reversal wipes out profits, while a bullish flag can signal a chance to ride the trend further. By leaning on patterns instead of gut feelings, you reduce guesswork and increase consistency.
Why do chart patterns repeat in the market?
You might wonder: why do these shapes appear again and again? The answer lies in human behavior. Fear, greed, hesitation these emotions drive traders in cycles, leading to recurring formations.
Markets may change, but psychology doesn’t. That’s why the same setups appear whether you’re trading forex, stocks, or crypto. This repetition makes patterns a reliable tool for those willing to study them.
Read more: How to trade the Forex market: Strategies & tools explained
The value of having a PDF guide:
With so many formations out there, it’s easy to feel overwhelmed. Having a chart pattern pdf solves that problem. Instead of scrolling through countless websites, you can keep a compact document that highlights the most common setups, explains their meaning, and shows visual examples.
Whether you’re learning at your desk or reviewing before a trading session, a day trading chart patterns pdf acts like a quick reference book, simple, practical, and always ready.
In summary, chart patterns are recurring shapes on price charts that reflect trader psychology. They are crucial for day traders to identify trends and entry/exit points quickly. Because these formations repeat across markets, having a clear PDF reference makes it easier to learn, remember, and apply them with confidence.
2. The most common chart patterns in day trading
When we talk about the most common chart patterns, traders usually divide them into two main groups: continuation and reversal. Continuation patterns suggest that the current trend is likely to keep going after a brief pause, while reversal patterns point to a potential shift in direction.
Understanding both groups helps you focus on the best chart patterns for day trading when reading live markets.
2.1. Continuation patterns: Flag, Pennant, Triangles, and Rectangles
Continuation patterns appear when the market takes a short break before resuming its previous trend. They give traders confidence to stay with the move rather than exit too soon.
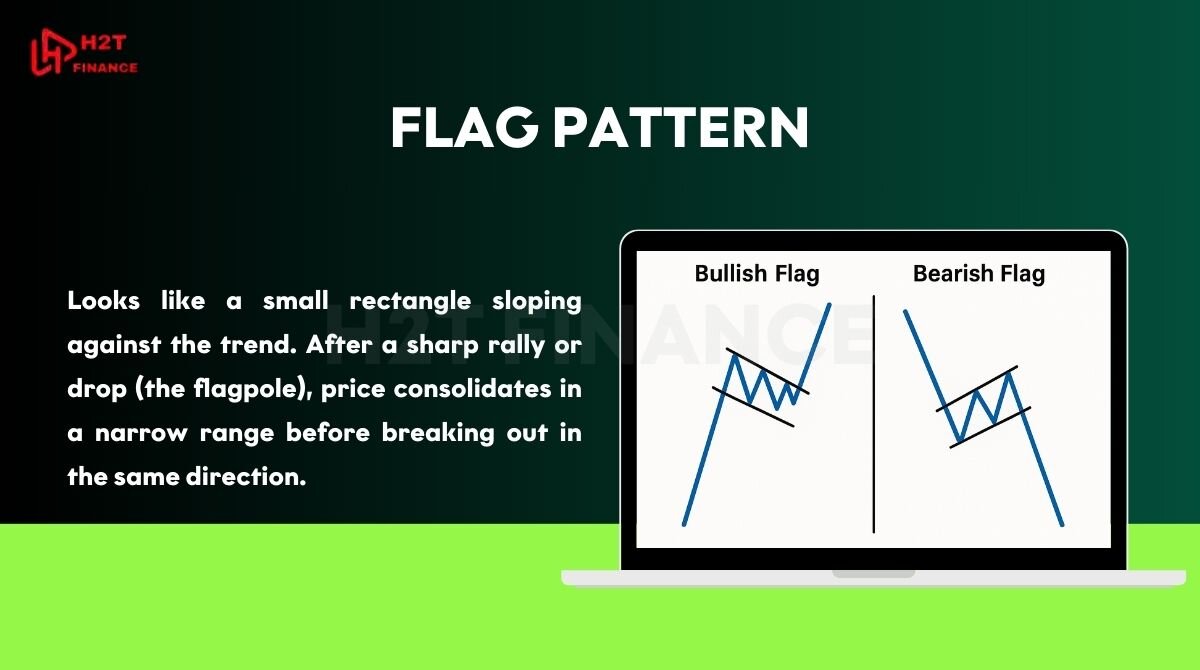
Flag pattern: Looks like a small rectangle sloping against the trend. After a sharp rally or drop (the flagpole), price consolidates in a narrow range before breaking out in the same direction. A bullish flag slopes slightly down in an uptrend, while a bearish flag slopes up in a downtrend. For day traders, flags are strong short-term signals to join momentum.
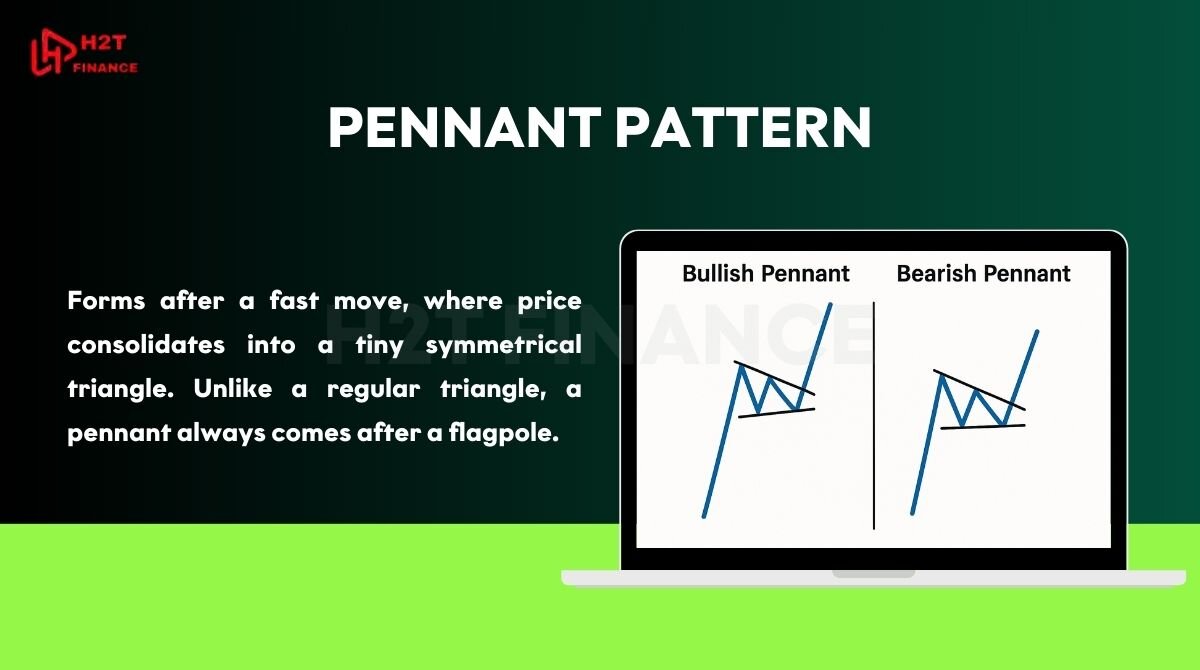
Pennant pattern: Forms after a fast move, where price consolidates into a tiny symmetrical triangle. Unlike a regular triangle, a pennant always comes after a flagpole. Breakouts usually follow the same direction as the initial move, especially when confirmed by volume. This makes pennants a high-energy signal often seen around news-driven volatility.
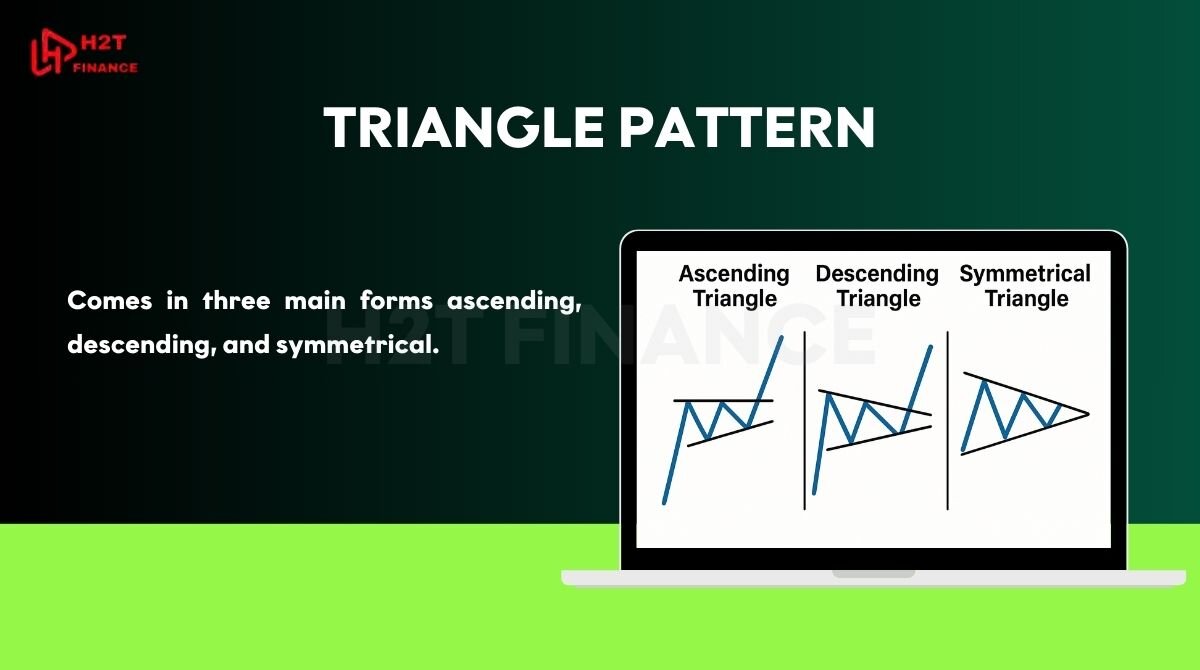
Triangle pattern: Comes in three main forms ascending, descending, and symmetrical.
- Ascending triangles are bullish, showing rising lows against a flat resistance line.
- Descending triangles are bearish, marked by falling highs against a steady support level.
- Symmetrical triangles reflect indecision, but often break in the direction of the prior trend. For intraday traders, triangles are useful to anticipate breakouts during consolidations; a Forex chart patterns pdf can help you spot them faster on major pairs.
Rectangle pattern: Price moves sideways between parallel support and resistance levels, forming a box. These ranges are like moments when the market "stalls," accumulating energy before deciding on its next move.
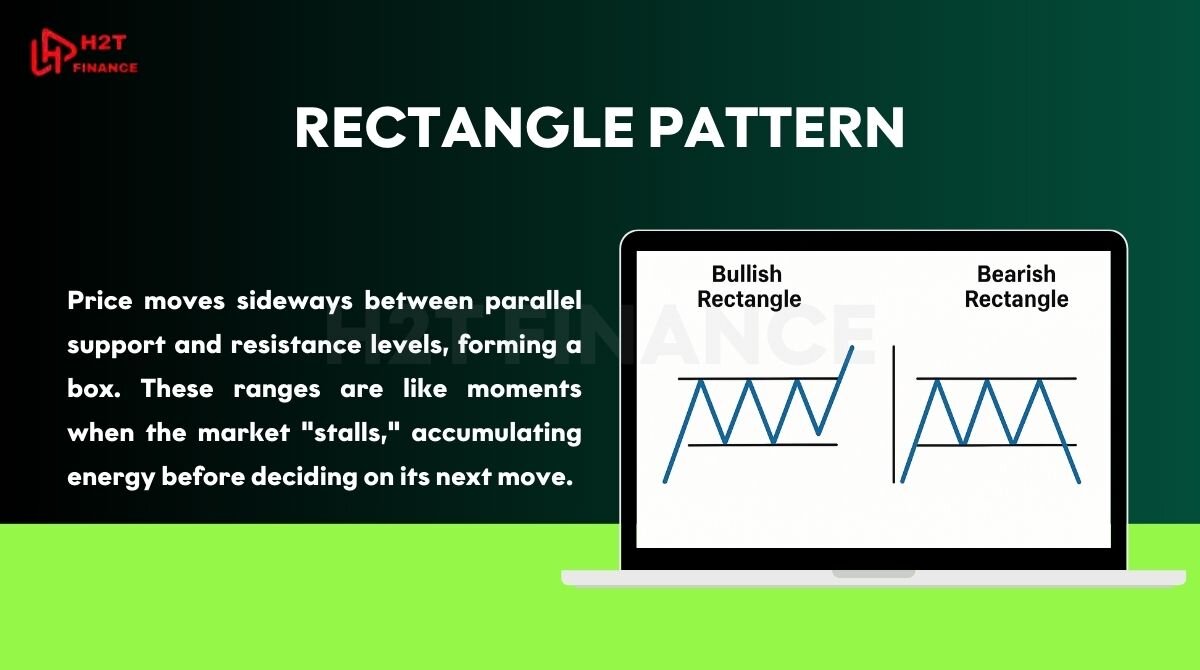
When rectangles occur in an uptrend, they usually break upward; in a downtrend, they tend to break lower. Day traders often play the breakout with tight stops placed just outside the opposite side of the range.
Flags, pennants, triangles, and rectangles are candlestick chart patterns that reveal pauses in a trend before continuation. Recognizing them allows traders to re-enter or add positions with better timing, reducing the risk of missing strong moves.
2.2. Reversal patterns: Head & Shoulders, Double Top/Bottom, Falling and Rising Wedge
Reversal patterns signal that the current trend is losing strength and may be about to turn in the opposite direction. These are essential for day traders to avoid overstaying a trade and to catch early entries keep a Reversal Chart Patterns PDF Free download handy for quick checks.
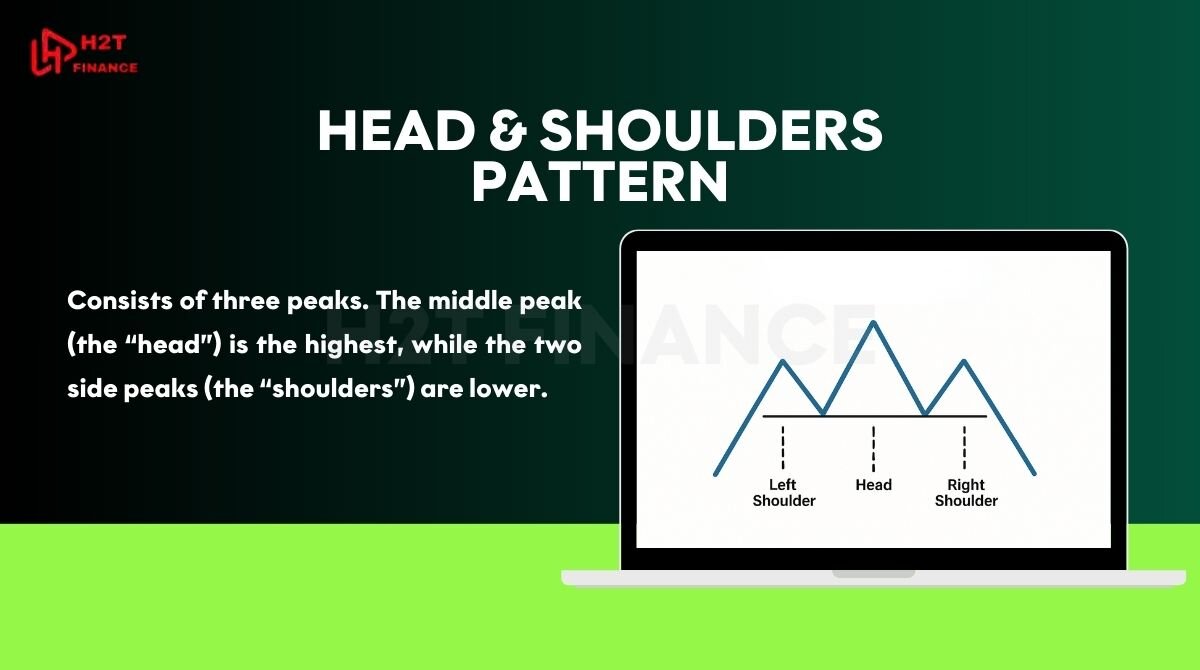
Head & Shoulders pattern: Consists of three peaks. The middle peak (the “head”) is the highest, while the two side peaks (the “shoulders”) are lower. Once price breaks below the neckline, it often signals a shift from an uptrend to a downtrend. The inverse version works the opposite way, indicating a possible bullish reversal.
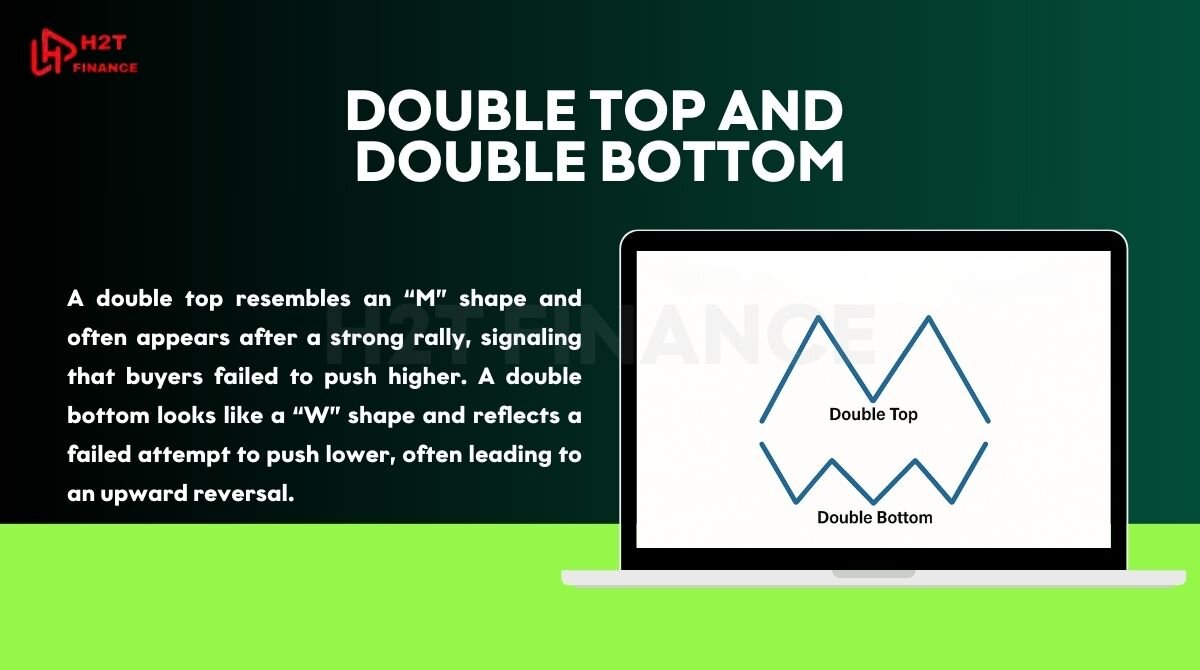
Double Top and Double Bottom: A double top resembles an “M” shape and often appears after a strong rally, signaling that buyers failed to push higher. A double bottom looks like a “W” shape and reflects a failed attempt to push lower, often leading to an upward reversal. For intraday setups, these are among the most common chart patterns traders rely on.
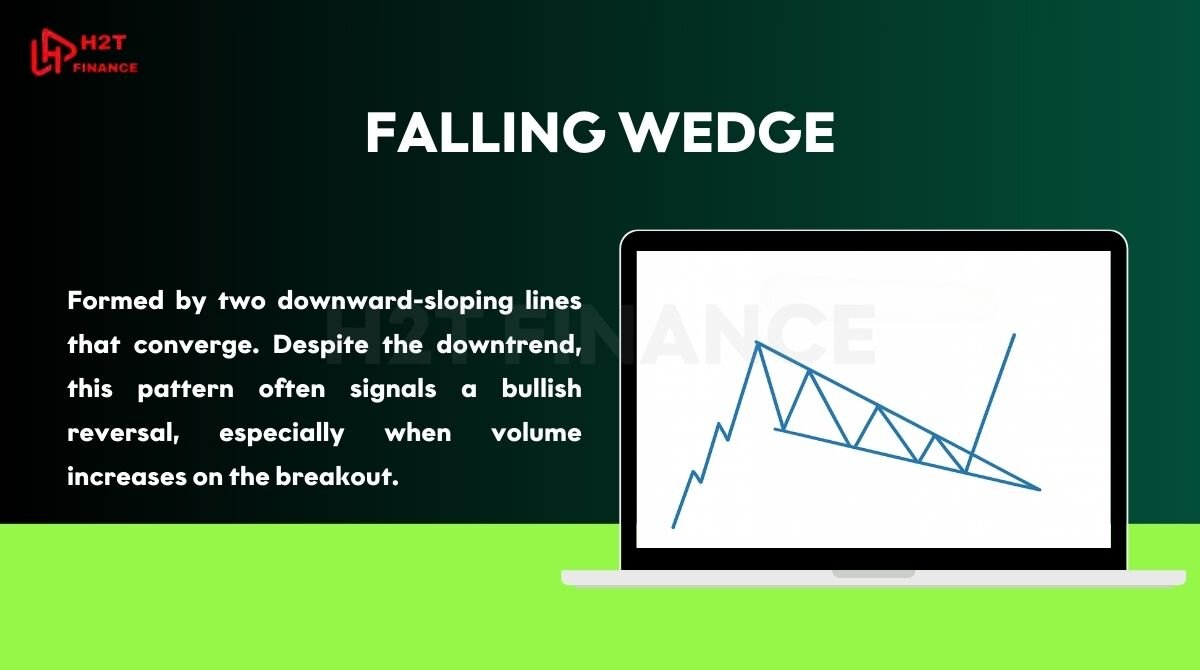
Falling Wedge: Formed by two downward-sloping lines that converge. Despite the downtrend, this pattern often signals a bullish reversal, especially when volume increases on the breakout.
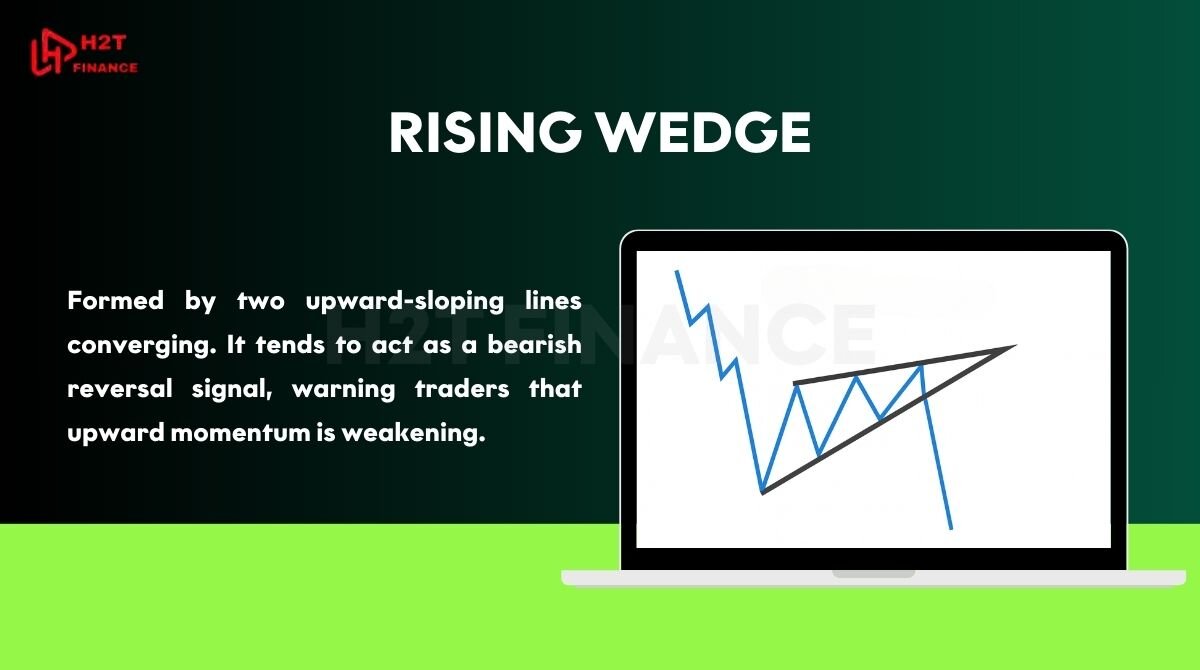
Rising Wedge: Formed by two upward-sloping lines converging. It tends to act as a bearish reversal signal, warning traders that upward momentum is weakening.
Head & Shoulders, Double Tops/Bottoms, and Wedges are key candlestick chart patterns that help traders spot turning points. For day trading, they are crucial tools to protect profits and anticipate trend changes early.
3. Examples of chart patterns in day trading
Learning chart patterns is one thing, but seeing how they work in real trades makes the knowledge stick. Below are two practical examples that show how traders use patterns to plan entries, exits, and manage risk.
3.1. Trading a double top pattern in the stock market
The double top is one of the most recognized reversal setups. Here’s how a day trader might approach it in real time:
- Spotting the pattern: Price rallies to a peak, pulls back, and then climbs again to test the same high but fails to break through. The chart now looks like an “M” shape.
- Confirming with volume: Volume is high on the first top but weaker on the second, signaling that buying pressure is fading.
- Planning the trade: Entry is planned below the neckline the support level between the two peaks. A stop-loss is placed slightly above the second top to protect against a false breakout.
- Executing and managing: Once the neckline breaks on strong selling volume, the short trade is triggered. A trailing stop can then be used to lock in gains as the price moves lower.
- Profit target: Many traders measure the distance between the tops and the neckline, then project it downward to estimate the move.
This setup helps intraday traders catch bearish reversals early and exit long trades before losses build up.
3.2. Spotting a bullish flag pattern on a forex chart
Flags are powerful continuation patterns that give traders confidence to rejoin a trend after a brief pause. Here’s an example with a currency pair like EUR/USD:
- Identify the move: Price surges upward, creating the flagpole, then consolidates in a small downward-sloping rectangle.
- Check confirmation: RSI shows room before hitting overbought, and the price stays above the moving average, confirming bullish sentiment.
- Plan the entry: The trader waits for price to break above the flag’s upper boundary before entering long.
- Set risk levels: A stop-loss is placed below the flag’s lower boundary, while a take-profit target is projected by measuring the flagpole height and adding it to the breakout point.
- Execute and monitor: Entry occurs as the breakout happens with rising volume. A trailing stop is adjusted upward as price continues to rally.
- Exit: The trade closes automatically at the take-profit level, or manually if reversal signals appear.
The bullish flag gives traders a structured way to ride trends with defined entry and exit rules, reducing emotional decision-making.
Double tops show how to catch reversals early in stocks, while bullish flags highlight how to stay with strong trends in forex. Together, these examples prove that chart patterns are more than theory; they are practical tools for making confident day trading decisions.
4. Comparing chart patterns with other tools
Chart patterns are powerful, but they are not the only way traders analyze markets. To trade effectively, many day traders compare them with other tools like indicators and price action methods. Understanding how they align or differ helps you build stronger strategies.
4.1. Chart patterns vs indicators (RSI, MACD…)
Indicators are mathematical calculations based on price and volume, while patterns are visual shapes on charts. Each has its role in decision-making:
- Chart patterns: Provide a visual roadmap of market psychology and highlight potential breakouts or reversals.
- RSI (Relative Strength Index): Measures momentum, showing if an asset is overbought or oversold.
- MACD (Moving Average Convergence Divergence): Tracks trend strength and possible shifts in momentum.
- How they work together: Using patterns with indicators adds confidence. For example, a bullish flag confirmed by RSI showing no overbought signals is stronger than relying on the flag alone.
4.2. Chart patterns vs price action
Price action focuses on raw candlestick movements without additional tools. Patterns, on the other hand, are structured interpretations of these movements. The main distinctions are:
- Chart patterns: Summarize common formations like triangles or wedges, which give recognizable entry and exit points.
- Price action: Relies on reading single candles or sequences, such as pin bars, engulfing candles, or rejection wicks.
- Practical use: Many day traders blend both - Day trading Chart Patterns : price action Patterns + candlestick Patterns to spot setups and fine-tune timing.
4.3. Pros and cons of relying only on chart patterns
While chart patterns are among the most common chart patterns used in day trading, depending on them alone can be risky.
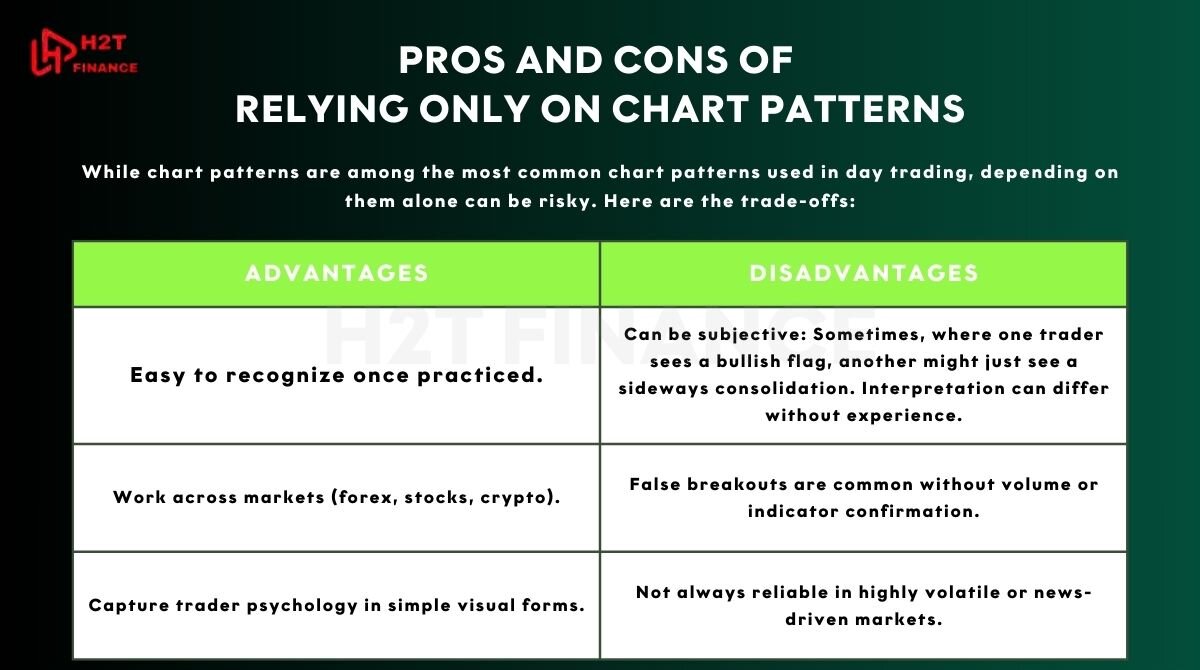
Here are the trade-offs:
- Advantages:
- Easy to recognize once practiced.
- Work across markets (forex, stocks, crypto).
- Capture trader psychology in simple visual forms.
- Disadvantages:
- Can be subjective: Sometimes, where one trader sees a bullish flag, another might just see a sideways consolidation. Interpretation can differ without experience.
- False breakouts are common without volume or indicator confirmation.
- Not always reliable in highly volatile or news-driven markets.
Chart patterns are a core tool, but they grow stronger when paired with indicators like RSI or MACD and confirmed through price action signals. Using them alone can limit accuracy, but combining them with other tools creates a balanced, more confident trading approach.
5. How to read trading chart patterns PDF
A trading chart patterns pdf is most useful when you know how to read and apply it in real situations. Instead of just memorizing shapes, you should connect the diagrams with actual trading decisions. Here’s how to read chart patterns in day trading and make the most of such a guide.
5.1. Labeled diagrams
A good PDF should include clear illustrations of each pattern. Labels on support, resistance, breakouts, and consolidation areas help you quickly recognize the structure.
- Look for arrows showing breakout directions.
- Pay attention to trendlines marking highs and lows.
- Note where the “neckline” or “flagpole” is drawn, since these are key decision zones.
5.2. Explanations of entry and exit points
Diagrams alone are not enough; you need guidance on how to act when you see a setup. Reliable PDFs provide simple rules for trading each pattern.
- Entry: Where to enter after confirmation of breakout or breakdown.
- Stop-loss: Commonly placed just outside the pattern to minimize risk.
- Take-profit: Often estimated by measuring the height of the pattern and projecting it in the breakout direction.
5.3. Examples from real charts
To bridge the gap between theory and practice, PDFs should also show actual candlestick charts. This is where patterns come alive.
- Spot a bullish flag on EUR/USD or a double top on a stock chart by keeping a candlestick chart pdf nearby for quick confirmation.
- Notice how volume shifts support or weaken the pattern.
- Compare the textbook version with the messy reality of live markets.
Read more: USD currency index chart: What it is & how to use it
Reading a chart pattern PDF means more than memorizing shapes. By studying labeled diagrams, following entry/exit guides, and reviewing real examples, traders can transform static pages into actionable strategies for day trading.
6. Download day trading chart patterns PDF
We've compiled all this core knowledge into a single day trading chart patterns pdf free download. This isn't just another candle stick chart pattern pdf; it's a strategic handbook you can carry anywhere, right on your phone or as a printout.
Instead of scrolling through endless articles, this guide gives you the most important setups, turning complex candlesticks into recognizable patterns. It saves you time, reduces mistakes, and helps you trade with reinforced confidence.
7. Tips to learn and master chart patterns quickly
Many traders rush to memorize every formation and end up overwhelmed. The truth is, you don’t need 20 different setups to succeed. What you need is a focused routine and the right habits to learn chart patterns fast without burning out.
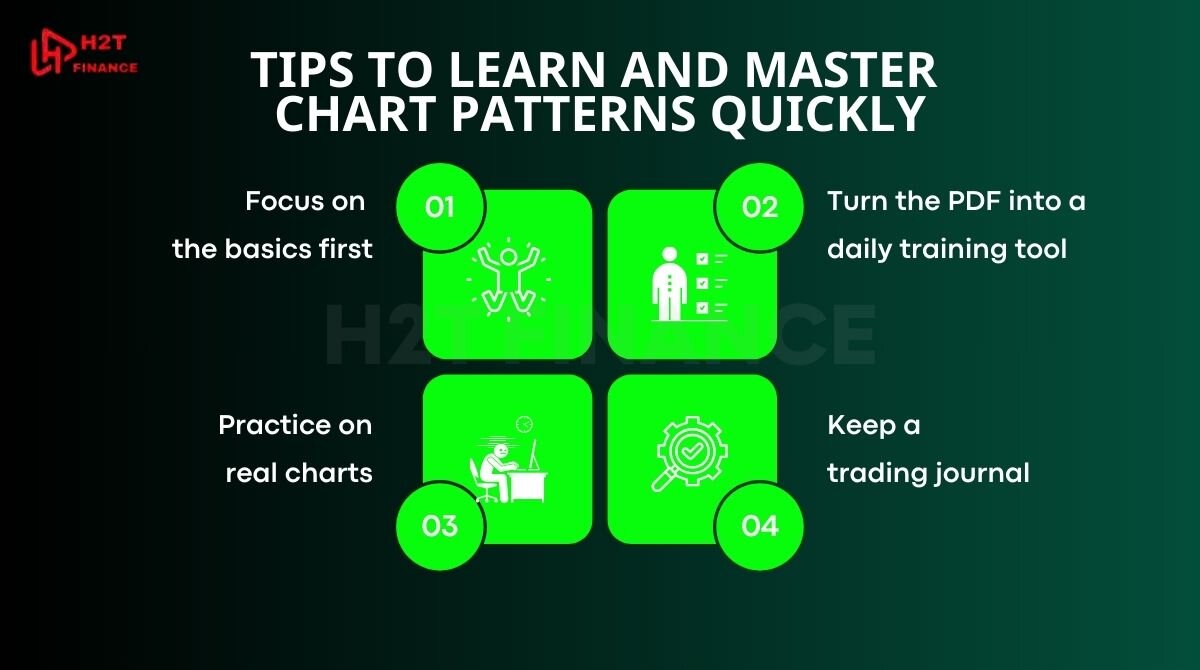
- Focus on the basics first: Start with 5–7 core setups like flags, triangles, head & shoulders, or double tops and bottoms. These are the foundation of trading, and mastering them gives you more confidence than chasing every obscure shape.
- Turn the PDF into a daily training tool: Don't just skim it. Use this trading chart patterns book pdf free like a set of visual flashcards. Every day, take a few minutes to look at a shape, name the pattern, and recall its meaning. This is how you "train the muscles" for your eyes, helping you recognize signals in a split second on live charts.
- Practice on real charts: Static diagrams are useful, but the real challenge is spotting patterns on messy charts. Open TradingView or MT4/5, scroll through history, and mark every setup you find. The more you do this, the faster your eyes will catch patterns as they form.
- Keep a trading journal: Write down every pattern you trade, why you took it, how it played out, and what you learned. Reviewing these notes turns mistakes into lessons and builds a personal playbook you can trust.
To master chart patterns, don’t overload yourself. Focus on a few key setups, treat your PDF as a flashcard tool, practice on real charts, and record your progress in a journal.
With patience and consistency, recognition will become second nature, and your trading decisions will feel less like guesses and more like informed choices. That's the first step to trading like an expert, turning the theory from a trade chart patterns like the pros PDF into your own practical skill.
See more articles in this category:
8. FAQs
8.1. What is the most successful day trading pattern?
Which chart patterns work best for day trading? There isn’t a single “best,” but flags, triangles, and head & shoulders are among the most reliable when combined with volume and trend confirmation.
8.2. What is the 5 3 1 trading strategy?
It means focusing on 5 currency pairs, using 3 trading strategies, and mastering 1 session (like London or New York) to avoid overwhelm.
8.3. Which chart is best for day trading?
Candlestick charts are preferred, as they show price action, momentum, and sentiment clearly within short timeframes.
8.4. What is the 15 minute rule in day trading?
It refers to waiting 15 minutes after the market opens before entering trades, allowing volatility to settle and clearer setups to form.
8.5. How to learn trading chart patterns?
Start with 5–7 core setups, study them using a chart patterns pdf, and practice spotting them on live charts daily.
8.6. How to find chart patterns in the live market?
Use trendlines and support/resistance zones on platforms like TradingView. Combine with volume and moving averages to confirm.
8.7. How to read stock chart patterns?
Identify shapes like double tops, triangles, or flags, then connect them with entry, stop-loss, and profit target rules.
8.8. How to download chart patterns PDF?
Look for a trading chart patterns pdf free download from trusted education sources or create one from your notes.
8.9. What are trading chart patterns?
They are recurring price formations like flags, wedges, or head & shoulders that reflect trader psychology and help predict future moves.
9. Conclusion – Are chart patterns enough for day trading?
Chart patterns give day traders a powerful foundation. They simplify complex price action into recognizable structures, making it easier to anticipate moves and react with confidence. Still, no matter how useful they are, chart patterns are not the ultimate solution. Relying only on them can be dangerous, especially in fast markets where false breakouts are common.
To become consistent, you need to combine chart analysis with tools like indicators, risk management, and broader market context. A day trading chart patterns PDF helps you start strong, but the real edge comes when you integrate patterns into complete strategies that include confirmation and discipline.
At H2T Finance, we believe that trading is a journey of continuous learning. Therefore, beyond this chart pattern PDF, we also share deep insights into Forex Strategies, guides for beginners, and practical tips you can apply immediately. Use this as your foundation, keep practicing, and let every trading session bring you closer to trading with clarity and control.