When we first started trading, candlestick charts looked like a confusing maze of red and green bars. Over time, we learned to read them, and now we share that journey through this candlestick PDF. This precisely explains the widespread search for a candlestick PDF, a compact guide you can easily download, read offline, and keep as a quick, indispensable reference.
In this article, we'll dive deep into the fundamental concepts, spotlight the most essential Candlestick patterns, share reliable sources for a candlestick analysis PDF, and equip you with practical tips to bridge the gap between theory and confident trading.
Key takeaways:
- Japanese candlesticks are the base language of price action and every trader should know how to read them.
- A well-structured candlestick PDF condenses this vital knowledge into a handy format, perfect for offline learning and rapid reviews. Think of it as your personal candlestick free handbook.
- The most common patterns include single-candle setups like Doji and Hammer, double patterns such as Engulfing and Tweezer, and triple patterns like Morning Star or Three Black Crows.
- For credible information, always seek candlestick chart patterns PDF files from trusted trading education sites, steering clear of unverified forums.
- Effective study means testing patterns on demo charts, keeping a trading journal, and focusing on context, not just shapes.
- PDFs are useful for building a base, while videos and courses offer deeper practice and mentorship.
- Success with candlesticks comes from consistent practice and combining them with tools like support and resistance or moving averages.
1. What is a candlestick and why is a candlestick PDF important for beginners?
The first time you encounter a trading chart, the array of red and green bars can be genuinely overwhelming, akin to deciphering a foreign language without a guide. These are Japanese candlesticks, the intuitive visual language that tells the story of price action.
1.1. The basics of Japanese candlesticks
Each candlestick represents a story of price movement within a specific time frame. The thick part, called the body, shows where price opened and closed.
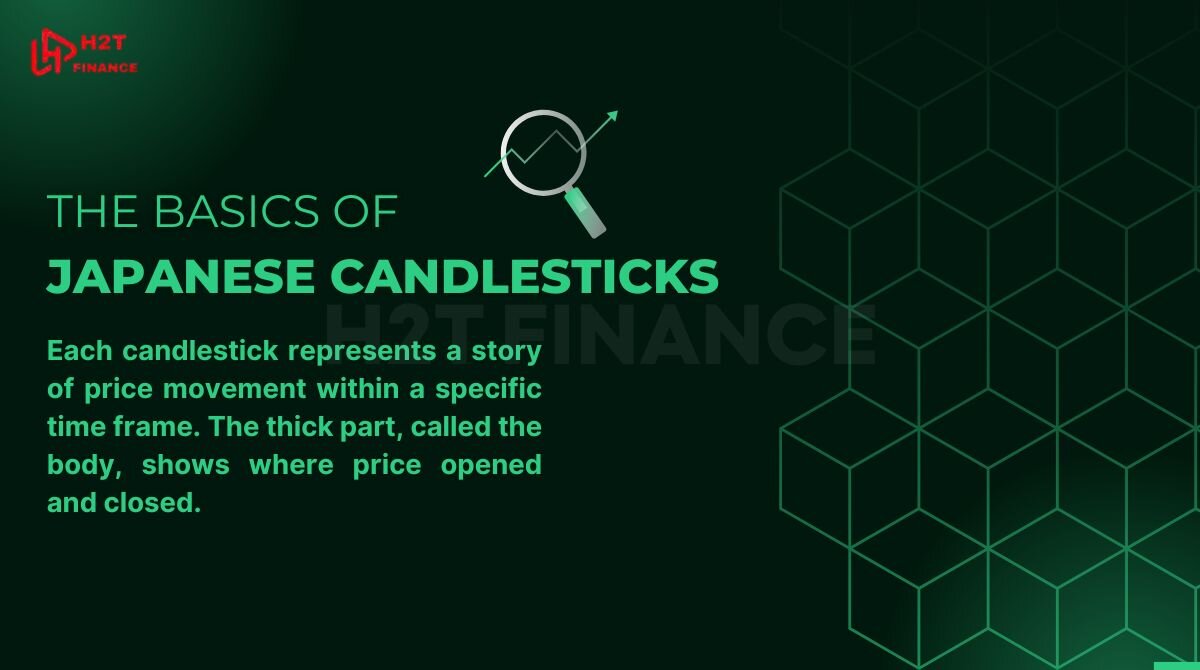
A green or white body signals that buyers pushed the price higher, while a red or black body reveals that sellers had control. Above and below the body are thin lines, known as shadows or wicks, showing the highest and lowest points reached during that session.
These shapes are not just numbers on a chart; they are traces of human behavior, fear, greed, hesitation, and conviction - written in a visual code. When traders learn to read them, they stop guessing and start understanding how the crowd moves money.
Read more: Forex currency trading hours: What time does the forex market open?
1.2. Why are PDFs a popular way to learn candlesticks?
For beginners, information overload is a genuine concern. Hundreds of patterns are mentioned across books and forums, making it easy to lose focus. A carefully crafted candlestick patterns PDF is a great solution to this challenge, consolidating all the essentials into a single, compact file: core definitions, frequently encountered Candlestick patterns, and crisp visuals you can save, print, and revisit offline. The key takeaway is this: always prioritize finding a quality candlestick pattern PDF.
However, not every PDF is created equal. Many circulating online are outdated, copied word-for-word from old blogs, or stuffed with patterns that confuse more than they teach.
Reliable resources from respected names such as H2T Finance, Investopedia, or Babypips are far safer choices, as they combine accuracy with clarity. For more in-depth reference material, you might search for "The Candlestick trading bible pdf" or "The candlestick trading bible pdf free Download" from reputable sources.
Summary:
- Candlesticks display open, close, high, and low prices within a timeframe.
- Green/white bodies signal buying pressure, red/black bodies show selling pressure.
- Wicks mark the extremes of price action.
- A candlestick chart patterns PDF provides a concise, conveniently offline-friendly method for learning.
- Quality matters: use trusted sources to avoid misinformation.
2. Basic candlestick patterns every beginner should know
When you open your first candlestick chart, the variety of shapes can feel endless. Yet in practice, traders often rely on just a handful of core formations. These patterns act like the “alphabet” of market psychology, helping you understand who is in control buyers or sellers and what may come next.
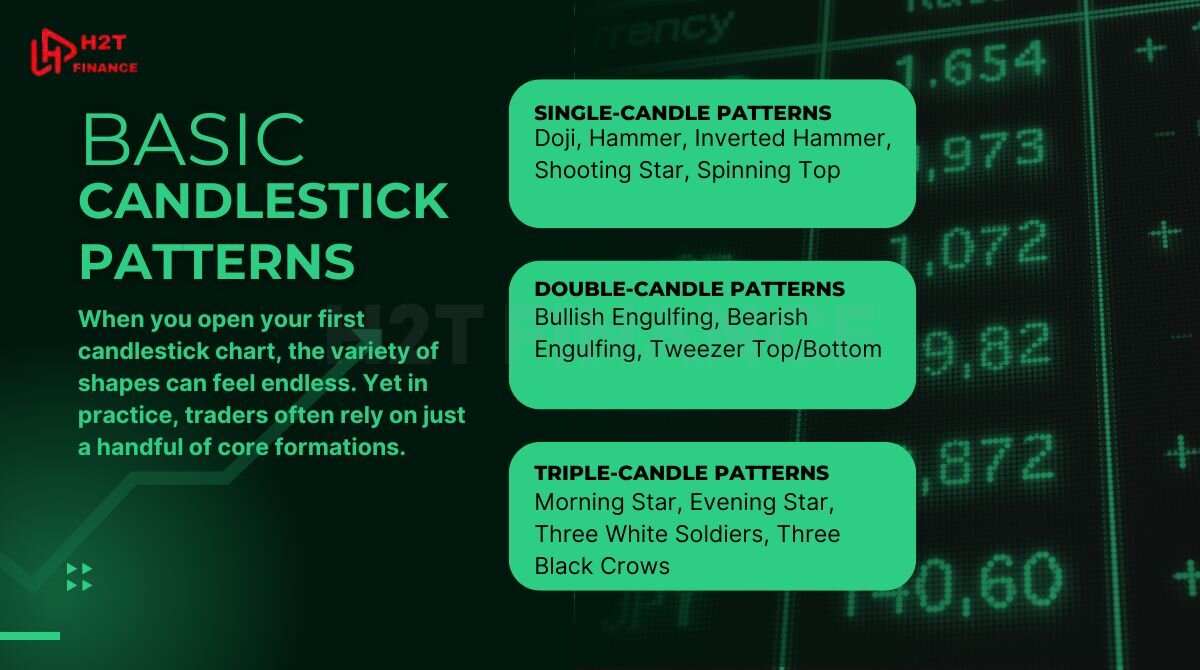
2.1. Single-candle patterns: Doji, Hammer, Inverted Hammer, Shooting Star, Spinning Top
Single-candle patterns are often the first signals traders learn. A Doji appears when the open and close are nearly equal, showing hesitation in the market. The Hammer, with its long lower shadow, reflects buyers stepping in after heavy selling pressure. Its opposite, the Inverted Hammer, hints at a possible bullish turn after a decline.
On the other side, a Shooting Star signals rejection at higher levels, warning of potential weakness. Finally, the Spinning Top shows a battle between bulls and bears, where neither side truly wins.
Each of these patterns may look simple, but they reveal powerful shifts in sentiment. Recognizing them on charts can help you sense early changes before the crowd reacts.
2.2. Double-candle patterns: Bullish Engulfing, Bearish Engulfing, Tweezer Top/Bottom
Double-candle patterns tell stories of struggle and sudden change. A Bullish Engulfing forms when a small bearish candle is swallowed by a larger bullish one, often signaling that buyers are seizing control.
In contrast, a Bearish Engulfing warns of sellers overpowering a weak bullish candle at the top of a rally. The Tweezer Top and Tweezer Bottom appear when two candles share nearly identical highs or lows, marking strong levels of resistance or support that the market struggles to break.
These patterns don’t just illustrate price action; they reflect a turning of the tide. For traders, they often mark moments where patience pays off and a new direction begins.
2.3. Triple-candle patterns: Morning Star, Evening Star, Three White Soldiers, Three Black Crows
Triple-candle setups add even more context by showing a shift across several sessions. The Morning Star, a bullish pattern, tells the story of sellers losing power followed by buyers stepping in with strength. Its bearish counterpart, the Evening Star, shows the reverse: optimism fading into exhaustion.
The Three White Soldiers represent relentless buying over three sessions, a classic signal of strong bullish sentiment. Meanwhile, the Three Black Crows warn of heavy selling pressure, with three consecutive bearish candles driving prices lower.
Such patterns carry weight because they confirm momentum over multiple sessions, reducing the chance that what you see is just noise.
While the world of candlestick patterns may seem overwhelming at first, mastering a small set of core examples is enough to build confidence. Doji, Engulfing, Stars, Soldiers, and Crows these classics appear repeatedly across markets and timeframes.
For beginners, focusing on 5–7 of these essentials will prevent overload and provide a clear lens to read market sentiment. Once these become second nature, the chart no longer feels like chaos, but a story you can finally understand.
3. Trusted sources for candlestick analysis PDF and how to choose quality files
When you search “candlestick PDF” online, you’ll find countless results promising the ultimate guide. The truth is, not all of them are worth your time. Some are outdated, others are copy-paste jobs with poor images, and a few even spread misleading information. That’s why choosing the right source matters as much as learning the patterns themselves.
One of the most reliable starting points is right here at H2T Finance, where we offer a dedicated candlestick free file meticulously crafted for clarity and practical application. It focuses on the most crucial Candlestick patterns and is specifically written with beginners in mind, making it easy to print or save for quick, efficient review.
Get your Candlestick pattern PDF free download today!
It’s also useful to know what type of file fits your level:
- Beginner PDFs: Cover basic candle anatomy and 5–7 must-know candlestick patterns.
- Intermediate PDFs: Introduce more complex double and triple setups with context.
- Advanced PDFs: Connect candlestick patterns to price action strategies, support/resistance, and risk management.
Whatever you do, avoid downloading random files from unknown forums or suspicious links. A low-quality PDF may waste your time, confuse you with incorrect visuals, or even give you harmful strategies. Good candlestick analysis requires trusted material, not clutter.
Quality PDFs save time and prevent mistakes, while poor ones only add to the confusion. By focusing on trusted names like H2T Finance, traders can learn candlesticks with confidence and keep their study materials clean, simple, and reliable.
4. How to study candlesticks from PDF effectively (and avoid rote learning)
We made the same mistake early on trying to memorize every candlestick shape as if trading were just a vocabulary test. What truly helped us was shifting focus to context and testing patterns directly on charts. The problem is, a pattern on its own means little if you don’t see it in the right market context.
A Hammer at the top of a rally is not a buy signal - it could be a trap. This is precisely why rote memorization from a candlestick pattern PDF frequently leads to frustration rather than genuine progress.
A better approach is to treat the PDF as a foundation, not the finish line. Start by reading to understand the logic behind each pattern why a Doji signals indecision, or how an Engulfing shows a sudden shift in momentum.
Then, put that knowledge to the test on a demo account. Even a few minutes of replaying old charts on TradingView or MT5 can make the theory “click” in a way that reading alone never will.
Another powerful habit is keeping a trading journal. Every time you spot a pattern, write it down: where it formed, what the market was doing before, and whether the outcome matched your expectation. Over time, you’ll build personal statistics that matter more than any generic win-rate from a textbook.
For deeper study, quality PDFs and books are worth your time. Titles like Japanese Candlestick Charting Techniques by Steve Nison or Candlestick Charting for Dummies by Russell Rhoads give structure and examples that you can’t get from random forum files.
On the research side, studies such as “Candlestick Technical Trading Strategies: Can They Create Value for Investors?” (Marshall, Young, Rose) or more recent works applying deep learning to candlestick recognition prove that this field is taken seriously even in academia.
Learning candlesticks is not about filling your head with endless shapes; it’s about seeing price behavior in its true environment. Use a PDF to learn the basics, test them on real charts, and document your progress. With that cycle, the patterns stop being abstract diagrams and become tools you can trust.
5. Candlestick PDF vs. videos vs. courses: Choosing what fits best
Every trader learns differently. Some prefer reading quietly, others absorb better by watching, and a few need guidance step by step. That’s why the way you study candlestick patterns matters as much as the patterns themselves.
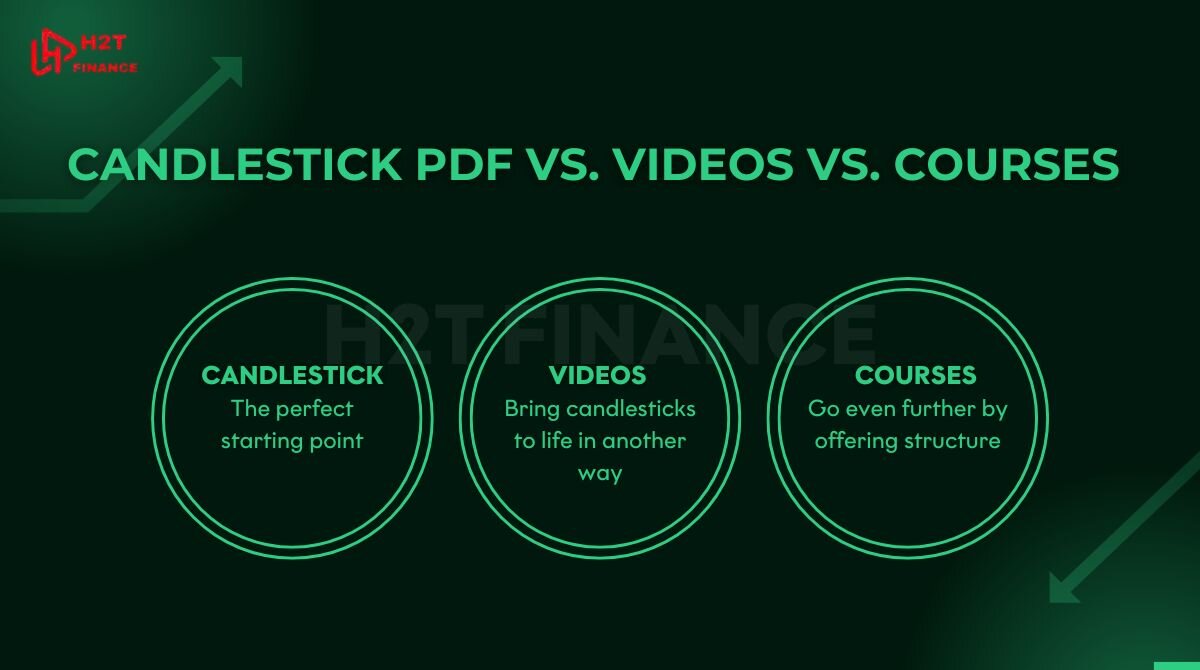
A chart pattern PDF is the perfect starting point. It’s compact, offline-friendly, and gives you the core definitions with visuals you can revisit anytime. For someone who wants a quick reference or to print out a cheat sheet, nothing beats a PDF.
Videos bring candlesticks to life in another way. When you see a Morning Star forming on an actual chart replay, the concept sticks far better than any static image. Visual learners often find that watching how patterns appear in real time makes them easier to remember and apply.
Courses go even further by offering structure. Instead of random lessons, you get a step-by-step path, sometimes with a mentor who can correct your mistakes. For those serious about trading as a skill, the guidance and feedback from a structured program can accelerate progress more than self-study ever could.
Still, no matter which format you choose, theory alone won’t be enough. The real breakthrough comes when you combine learning with practice: study from a PDF, watch examples in videos, then test and refine your understanding directly on charts.
PDFs give you the foundation, videos make the lessons stick, and courses provide structure. The best approach is not choosing one over the other but weaving them together with real chart practice. That’s when candlestick knowledge truly becomes trading skill.
Read more:
6. FAQs
6.1. Are candlestick patterns really effective?
Yes, but not magic. They work best in trending markets and when confirmed by volume or indicators. In sideways markets, their signals often fail.
6.2. Should I pay for advanced candlestick PDFs or is free enough?
Free PDFs like those from H2T Finance or Babypips cover the basics very well. Paid material is useful only if it adds structured strategies or mentoring.
6.3. How long does it take to learn all candlestick patterns?
Memorizing shapes may take weeks, but truly mastering them in context usually takes months of practice with real charts.
6.4. Can candlesticks be used in crypto, stocks, and forex?
Absolutely. The psychology behind candles works across all liquid markets, from Bitcoin to EUR/USD to Apple stock.
6.5. How many candlestick patterns exist?
Around 40 well-documented ones, but in practice traders usually rely on 10–15 core setups.
6.6. How do I identify a candlestick pattern?
Check the open, close, high, and low of each candle. Match the shape to known patterns, but always confirm with market context.
6.7. What is the 3-candle rule?
It’s a sequence where two candles hint at reversal and the third confirms it. Traders use it to spot short-term momentum shifts.
6.8. What is the 5-minute candle strategy?
It’s an intraday approach using 5-minute charts to trade fast setups like Doji or Engulfing, often combined with indicators.
6.9. What is the success rate of candlestick patterns?
On average, 50–60%. Some like Engulfing or Morning Star test higher, but no pattern guarantees profit.
6.10. Are candlestick patterns reliable?
They are reliable only when paired with context trend, support/resistance, or volume. Alone, they can mislead.
6.11. How to combine candlesticks with technical indicators?
Use moving averages for trend, RSI for overbought/oversold, or Bollinger Bands for volatility. Together, they filter bad signals.
6.12. What are the limitations of candlesticks?
They lose power in choppy markets, and interpretation can be subjective. False signals are common without confirmation.
6.13. In what market conditions are candlesticks most effective?
They shine in clear, trending markets where momentum is strong. In flat ranges, they often give noise instead of clarity.
6.14. Which timeframe works best for candlestick trading?
Daily and 4-hour charts give the most reliable signals. Shorter frames like 5-minute can work but include more noise.
6.15. How are candlestick patterns formed on a chart?
Each candle is built from four points: open, close, high, and low of a chosen timeframe. Their shape reflects the battle between buyers and sellers.
7. Conclusion
A candlestick PDF is the ideal starting point for any novice, but it's just the starting line. True progress comes when you take those Candlestick patterns off the page and apply them directly to live charts. As countless traders have discovered, memorizing shapes is straightforward, but cultivating confidence through diligent practice is what truly distinguishes learners from consistent, successful performers.
Remember this simple truth: a successful trader is not the one who downloads the most candlestick analysis PDF files, but the one who practices the most with discipline and patience.
Here at H2T Finance, we offer a dedicated candlestick free PDF to equip you with that crucial foundational knowledge. However, should you wish to advance further, we invite you to explore our Forex Strategies category, where we share comprehensive guides on price action basics, trading effectively with support and resistance, and numerous other proven methodologies.
Download our candlestick PDF now and continue to sharpen your trading edge – step by step, chart by chart.