Support and resistance indicators are among the most trusted tools in technical trading, helping traders pinpoint critical price levels where market momentum often shifts. From institutional strategies to retail setups, these indicators provide a tactical edge by highlighting zones of potential reversal or breakout. As volatility reshapes global markets daily, mastering how to read and apply these levels isn't just helpful it's essential. Stay ahead of the curve and start integrating the most effective support and resistance indicators into your strategy today.
Key takeaways:
- Core concept: Support and resistance levels are critical price zones where market momentum often shifts, driven by trader psychology and historical price reactions.
- Why they matter: These levels help traders identify entry/exit points, set stop-loss/take-profit orders, and calculate risk-reward ratios with precision.
- Identification techniques: Use historical price reactions, candlestick patterns, and multi-timeframe analysis to confirm strong support and resistance zones.
- Top indicators: Master tools like Moving Averages, RSI, Volume, Fibonacci Retracements, and LuxAlgo’s Orderblocks for reliable zone detection.
- Advanced tools: Volume Profile, VWAP, trendlines, and round numbers provide deeper insights into market sentiment and institutional activity.
- Avoiding pitfalls: Prevent common mistakes like single-timeframe reliance, ignoring volume, or overcomplicating charts with too many indicators.
- Breakout validation: Confirm true breakouts with candle closes, high volume, and momentum indicators to avoid false signals.
- Universal application: These indicators are effective across forex, crypto, and stocks, with platforms like TradingView offering robust tools for analysis.
1. What are support and resistance indicators levels in trading?
Support and resistance levels are fundamental concepts in technical analysis, forming the backbone of many trading strategies.
Support refers to a price level where demand tends to absorb selling pressure, often leading to a pause or reversal in a downtrend. Resistance is the opposite a price point where selling interest overcomes buying, often halting an uptrend.

These levels emerge due to price memory and psychological barriers. Traders remember key price levels and often react similarly when prices revisit those zones. For instance, when Bitcoin falls to $20,000 and then bounces, that level becomes a psychological support.
Real world charts from forex and crypto markets frequently show price consolidating or reversing around previous support and resistance levels. These zones guide entries, exits, and stop loss placements, making them indispensable for technical traders.
2. Why support and resistance matter in technical nalysis
Understanding these levels helps traders anticipate where price might react, offering a powerful edge in decision making.
Support and resistance indicators allow traders to:
- Identify optimal entry and exit points by observing where price has historically bounced or reversed.
- Set more accurate stop loss and take profit orders by aligning them with tested price levels that reflect crowd behavior.
- Define the risk reward ratio more precisely based on previous reactions to these levels, helping traders control losses and lock in profits.
These levels aren’t just technical they represent trader psychology in motion. Every touchpoint at a support or resistance level reflects human emotion: fear of missing out, greed, doubt, and conviction.
From a psychological standpoint, concepts like anchoring bias where traders fixate on specific price levels reinforce the significance of support and resistance. These zones encapsulate collective memories, expectations, and behavior.
As the CMT Association notes: "Support and resistance are key market reference points that influence crowd behavior more than any other factor."
In my view, learning how to properly identify and apply support and resistance indicators is one of the best investments a trader can make. It bridges technical skill with trader psychology and that’s where real mastery begins.
3. How to identify support and resistance zones
Spotting key levels accurately is a foundational skill that separates experienced traders from beginners and it's a skill that sharpens over time with chart time, pattern recognition, and disciplined observation.
3.1. Start With Historical Reactions
Begin by drawing horizontal lines at price points where the market has reversed or stalled multiple times. These areas represent supply and demand imbalances and the more touches without breaking, the stronger the level. These are often the basis for strong best support and resistance indicator.
Support Zone Example: If EUR/USD repeatedly bounces around 1.0800 without breaking lower, that level becomes a support zone.
Resistance Zone Example: If BTC fails to move above $30,000 despite multiple attempts, that level is a resistance barrier.
Tip: Don’t look for exact numbers. Price reacts in zones, not perfect lines.
3.2. Use price action clues for confirmation
After marking a zone, look for candlestick signals that confirm buyer/seller interest:
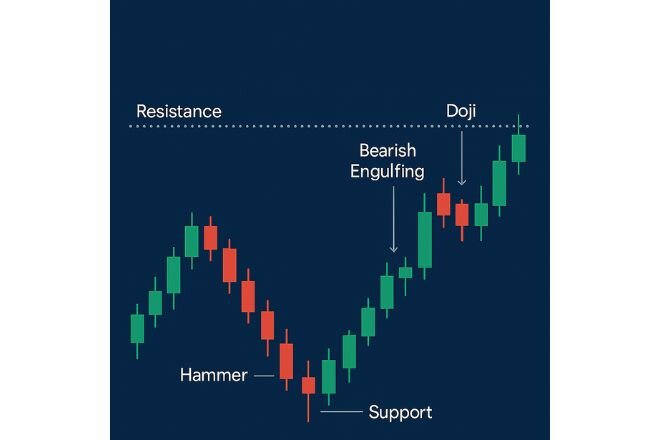
- A long lower wick or hammer candle near support often signals buying pressure.
- An engulfing bearish candle near resistance may indicate a reversal.
- Doji candles can represent indecision a potential turning point when they appear at key levels.
These price patterns offer contextual confirmation, increasing the reliability of your support and resistance indicators.
3.3. Apply multi timeframe analysis
A single chart can be misleading. Confirm your zones by checking higher and lower timeframes:
- Daily chart for macro levels
- 4H or 1H charts for intraday validation
- 15min or 5min for scalping adjustments
A support level that appears across multiple timeframes carries higher conviction, as it reflects alignment among traders with different strategies (long term investors, day traders, etc.).
This multilayered approach to identifying support and resistance indicators reflects how real professionals operate not by guesswork, but by stacking evidence.
4. Top 5 support and resistance Indicators every trader should know
Support and resistance indicators are essential tools that help traders identify key price zones where the market is likely to reverse or continue its trend. Below are the top five indicators every trader should master to improve trading accuracy.
4.1. Moving Averages
Moving Averages (MA) are dynamic support and resistance indicators that adapt to price movements over time, aiding in trend identification and key price zones. There are two main types: Simple Moving Average (SMA), which calculates the average price with equal weighting, and Exponential Moving Average (EMA), which prioritizes recent prices for faster market reaction.
Popular MAs like EMA 20, SMA 50, and SMA 200 are widely used across various timeframes. For instance, EMA 20 often acts as intraday support in fast-moving markets, while SMA 200 serves as a long-term support or resistance barrier on daily or weekly charts.
Summary table for Moving Averages:
| MA Type | Timeframe | Application | Sensitivity |
|---|---|---|---|
| EMA 10-20 | Short-term | Intraday trading, scalping | High, reacts quickly to price |
| SMA 50 | Mid-term | Swing trading, trend identification | Moderate, more stable |
| SMA 200 | Long-term | Long-term trend identification, key support/resistance | Low, suitable for long-term investment |
How to apply and use:
- Trend Identification: Use MAs to determine if the market is in an uptrend (price above MA) or downtrend (price below MA). For example, a price bounce from EMA 20 in an uptrend may signal a buying opportunity.
- Confirm support/resistance: Observe price reactions at MAs (e.g., SMA 200 often acts as strong resistance in a downtrend).
- Combine with other tools: Pair MAs with volume or candlestick patterns (e.g., hammer candle near EMA 20) for greater reliability.
- Crossover strategy: Use MA crossovers (e.g., EMA 20 crossing above SMA 50 – Golden Cross) to identify entry points.
4.2. Relative Strength Index (RSI)
RSI is a momentum indicator that measures the speed and change of price movements, helping identify overbought (potential resistance) or oversold (potential support) zones. RSI ranges from 0 to 100, with levels above 70 indicating overbought conditions and below 30 indicating oversold conditions.
RSI is particularly useful for spotting divergence. For example, bearish divergence (price forms a higher high, but RSI forms a lower high) near resistance may signal a reversal.
Summary table for RSI:
| RSI level | Market condition | Trading signal |
|---|---|---|
| Above 70 | Overbought | Potential resistance, consider selling |
| Below 30 | Oversold | Potential support, consider buying |
| 40-60 | Neutral | Price consolidation, await confirmation signals |
How to apply and use:
- Confirm support/resistance: RSI above 70 near resistance or below 30 near support increases the reliability of these zones.
- Spot divergence: Look for bullish divergence near support or bearish divergence near resistance to predict reversals.
- Combine with volume: Pair RSI with sudden volume spikes at support/resistance for stronger signal confirmation.
- Timeframes: Use RSI on 4H or 1H for intraday trading or daily charts for longer-term trends.
4.3. Volume
Volume is a critical indicator for confirming the strength of support and resistance levels. High volume at a key price level indicates strong market participation, increasing the likelihood of the level holding or breaking.
For example, a price bounce at support with high volume suggests strong buying pressure, while low volume during a breakout may indicate a false breakout.
Summary table for Volume:
| Volume pattern | Price action | Market signal |
|---|---|---|
| High volume at support | Price bounces | Strong support, likely to hold |
| High volume at resistance | Price rejected | Strong resistance, potential reversal |
| Low volume on breakout | Price breaks level | Risk of false breakout |
| High volume on breakout | Price breaks level | True breakout, trend continuation |
How to apply and use:
- Confirm support/resistance: Check volume at key price levels. High volume at support or resistance confirms their reliability.
- Spot breakouts: A breakout with strong volume is likely to continue, while low volume warns of a false breakout.
- Combine with other tools: Use Volume Profile or On Balance Volume (OBV) with candlestick patterns for greater accuracy.
- Monitor anomalies: Watch for volume spikes at price levels to detect institutional activity.
4.4. Fibonacci Retracements
Fibonacci Retracement levels use mathematical ratios (23.6%, 38.2%, 50%, 61.8%) to identify potential support and resistance zones within a market trend. The 61.8% (golden ratio) is often a strong reversal zone, especially when combined with price action or volume signals.
For example, if ETH rises from $1,000 to $1,500, the 38.2% retracement level ($1,309) may act as support during a correction.
Summary table for Fibonacci Retracements:
| Fibonacci level | Market condition | Trading signal |
|---|---|---|
| 38.2% | Shallow retracement | Buying opportunity in uptrend |
| 50% | Moderate retracement | Psychological support/resistance |
| 61.8% | Deep retracement (golden ratio) | Strong reversal level |
How to apply and use:
- Draw Fibonacci levels: Apply the Fibonacci tool from low to high (uptrend) or high to low (downtrend) to identify retracement levels.
- Find confluence: Combine Fibonacci levels with horizontal support/resistance, MAs, or volume for higher reliability.
- Confirm with price action: Look for candlestick patterns (e.g., hammer or engulfing candles) at Fibonacci levels to confirm signals.
- Use in trending markets: Apply Fibonacci in clear trending markets to predict correction zones.
4.5. LuxAlgo Price Action Concepts Toolkit: Orderblocks Feature
The LuxAlgo Price Action Concepts Toolkit offers the Orderblocks feature, an advanced tool for identifying support and resistance zones based on market structure and order flow analysis. Orderblocks are price zones where large institutional orders are placed, often leading to strong price reactions like reversals or consolidation.
This feature is particularly valuable for detecting zones where institutional traders are active, offering deeper insights than traditional indicators.
Summary table for Orderblocks feature:
| Characteristic | Application | Market signal |
|---|---|---|
| Bullish Orderblock | Support in uptrend | Price bounces, buying opportunity |
| Bearish Orderblock | Resistance in downtrend | Price rejected, selling opportunity |
| High volume at Orderblock | Confirms strong zone | Reliable support/resistance |
How to apply and use:
- Identify Orderblocks: Use LuxAlgo on TradingView to automatically detect Orderblocks based on price structure.
- Combine with Volume: Orderblocks with high trading volume are typically stronger support/resistance zones.
- Confirm breakout or reversal: Observe price action at Orderblocks (e.g., Doji or engulfing candles) to determine entry points.
Multi-timeframe analysis: Check Orderblocks on higher timeframes (e.g., 4H, daily) for key zones, then refine entries on lower timeframes (e.g., 1H, 15M).
5. Advanced support and resistance tools
Beyond traditional horizontal lines, modern trading platforms offer advanced support and resistance indicators that provide deeper insights into price behavior and market sentiment. These tools help traders uncover hidden levels of interest and strengthen their technical setups.
5.1. Volume profile
The Volume Profile is a powerful visual support and resistance indicator that displays the volume traded at each price level over a specific period. High volume nodes represent areas where the market has spent more time signaling strong support or resistance zones. These levels indicate price areas of acceptance and can act as magnets where price revisits, pauses, or reverses.
Why it matters: High volume zones often coincide with institutional activity, making them reliable support and resistance indicators for swing and position traders.
5.2. VWAP (Volume Weighted Average Price)
VWAP is a dynamic support and resistance indicator used primarily by institutional traders. It calculates the average price weighted by volume, offering a fair value benchmark for the trading day.Price trading above VWAP may indicate bullish strength, while price below suggests bearish sentiment.
Why it matters: VWAP acts as a moving balance point between buyers and sellers, making it a practical intraday support or resistance level, especially in high frequency trading environments.
5.3. Trendlines and channels
Diagonal lines, when drawn properly, can serve as dynamibest support and resistance indicator trading view that adapt to market structure. Connecting swing highs or lows forms trendlines, and pairing parallel lines creates price channels.
- Uptrend lines often act as rising support
- Downtrend lines serve as descending resistance
These visual tools help traders anticipate pullbacks and breakouts, especially when used with horizontal support and resistance zones.
5.4. Round numbers
Round numbers like 1.2000 in EUR/USD or $30,000 in Bitcoin are classic support and resistance indicators based on trader psychology. These levels attract attention due to their simplicity and are often used for setting orders.
Why it matters: Many traders place stop losses, take profits, or limit orders near round numbers reinforcing their role as reliable support and resistance zones across all asset classes.
6. Common mistakes when using support and resistance indicators
Avoiding these common pitfalls can significantly improve the accuracy and reliability of your technical analysis when using support and resistance indicators:
6.1. Using only one timeframe
Overreliance on a single chart timeframe such as just the 15 minute or daily chart can lead to false conclusions. hat is support and resistance indicator become far more powerful when confirmed across multiple timeframes.
Helpful tip: Use multi timeframe analysis to validate key support and resistance zones. A level that holds on the daily, 4-hour, and 1-hour charts carries much more weight than one found on a single intraday view.
6.2. Ignoring volume
Volume is a crucial confirming factor when analyzing support and resistance indicators. If a price reacts strongly at a key level with high volume, that level is more likely to hold or break decisively.
Helpful tip: Combine traditional support and resistance tools with volume-based indicators like Volume Profile or On Balance Volume (OBV) to improve the accuracy of your signals.
6.3. Cluttering charts with too many indicators
Using too many technical indicators at once such as multiple oscillators, trendlines, and overlays often creates conflicting signals and visual noise. This leads to indecision and inconsistent results.
Best practice: Focus on a few core support and resistance indicators like Fibonacci retracement, pivot points, and moving averages, and look for confluence where these tools align. Clean charts enhance clarity and support better decision makin
Effective trading with support and resistance indicators depends on clarity, confirmation, and confluence. Avoid these mistakes to make your analysis more disciplined and aligned with professional grade strategies.
7. How to know when support or resistance has truly broken
Identifying a true breakout is one of the most important and often misunderstood skills in trading with support and resistance indicators. Many traders fall victim to false breakouts, where price temporarily moves beyond a level, only to reverse and trap positions.
7.1. What is a false breakout?
A false breakout happens when price pierces a key support or resistance zone but quickly reverses back, causing traders to enter prematurely or exit wrongly. This is especially common in volatile markets like crypto and forex.
To avoid these traps, traders must learn how to confirm whether support and resistance indicators are signaling a valid breakout or a fakeout.
7.2. Key signs of a valid breakout
Candle Close Beyond the Level
One of the most reliable signs is a confirmed candle close above resistance or below support on a higher timeframe (like the 1-hour, 4-hour, or daily chart). This indicates that the market has accepted the new price level and that the breakout may be sustained.
Increased volume at the break
Volume is a critical part of validating support and resistance indicators. A true breakout is often accompanied by a volume spike, reflecting strong buying or selling interest. If the price breaks through a support or resistance level but the trading volume is low, it usually means the breakout is weak and might not last.
Momentum confirmation
Use momentum tools like MACD, RSI, or Stochastic Oscillators to gauge strength. For example:
- A bullish MACD crossover during a resistance break adds weight to the breakout.
- An overbought RSI without volume support could warn of exhaustion rather than continuation.
Traders who rely solely on static price levels without validating with support and resistance indicators like volume and momentum often misinterpret market moves. Confirmation from multiple indicators ensures you're not trading based on noise but on real market intent.

To trade breakouts effectively, don’t just watch price read the context through support and resistance indicators, volume, and higher timeframe confirmations. A breakout without confirmation is just a trap waiting to happen.
8. FAQs: Mastering support and resistance indicators
8.1. What are the best support and resistance indicators for trading?
The best support and resistance indicators vary depending on your trading style, but some of the most trusted tools include Fibonacci retracement levels, pivot points, and moving averages (like the 50 SMA or 20 EMA). These indicators are especially powerful when combined with price action analysis and volume based tools like Volume Profile or VWAP. For short term strategies, Camarilla pivots and Murrey Math lines also offer precise support and resistance signals.
8.2. How can I tell if a support or resistance level is valid?
To verify the strength of a zone, look for multiple price reactions at that level. Valid support and resistance indicators are often confirmed by:
- Repeated touches without breaks
- Candle formations (like pin bars, engulfing patterns)
- A confluence of tools across multiple timeframes
- High volume confirming the level’s relevance
If price reverses strongly from a zone with strong volume and momentum indicators, it likely represents a valid support or resistance level.
8.3. Can support and resistance indicators be used in crypto trading?
Yes support and resistance indicators in crypto work just as effectively as they do in forex, stocks, or commodities. Whether you’re trading Bitcoin, Ethereum, or altcoins, the same psychological levels apply. Tools like Fibonacci retracement, VWAP, and pivot points are frequently used by crypto traders to map key zones and anticipate breakouts or reversals.
8.4. What platform offers the best support and resistance indicators?
TradingView is one of the most recommended platforms for identifying and testing support and resistance indicators. It provides:
- Built-in tools like Fibonacci, pivot points, and moving averages
- Volume-based tools like VWAP and Volume Profile
- Custom scripts created by the TradingView ccommunity: are user-generated tools and indicators shared by traders to enhance charting and analysis capabilities beyond the default options.
These features make it ideal for both beginners and advanced traders looking to improve their support and resistance trading strategy.
8.5. Are round numbers reliable as support and resistance zones?
Absolutely. Round numbers such as 1.0000, 1.5000, or $10,000 often serve as psychological support and resistance levels. These levels attract attention from both retail and institutional traders and are frequently used to place orders or measure sentiment. Many support and resistance indicators reinforce these levels, making them reliable areas to watch for potential reversals or breakouts.
9. Final Thoughts: How to master support and resistance indicators for smarter trading
Mastering support and resistance indicators is not just about recognizing lines on a chart it's about understanding the underlying psychology that drives price action. Throughout this guide, we explored the most effective tools traders use to identify and validate support and resistance zones.
We also outlined the most common mistakes traders make such as relying on a single timeframe or ignoring volume and showed how to avoid false breakouts by combining price action, volume, and momentum indicators. Most importantly, we emphasized a strategy rooted in confluence and multi timeframe analysis, which reflects how experienced traders build their edge.
As someone deeply immersed in financial markets, I know from experience that no single tool guarantees success. But when multiple support and resistance indicators point to the same conclusion and you’ve done the work to understand why that’s when you’re trading with confidence, not just hope.
Whether you trade forex, crypto, or stocks, these techniques apply across all markets due to the universal nature of price psychology.
See more information here:
- Floating currency exchange rate explained for Forex implications
- Forex currency trading hours: What time does the forex market open?
- Forex Market Structure: Patterns, Tools & How to Read It
Explore the Forex Basics category on the H2T Finance newspaper page your go-to resource for practical trading education, market insights, and beginner to pro strategies written by real traders, for traders.


