Day trading the SPX can be brutally overwhelming. We've all been there staring at a chart that looks like a 5-year-old's spaghetti art, with dozens of signals flashing and yet offering no clear direction. Many beginners believe more indicators mean more accuracy, but the harsh reality is it often leads to hesitation, late entries, and painful stop-outs.
The truth is simple: the S&P 500 index is liquid, volatile, and reacts quickly to news. To survive intraday, traders need clarity, not clutter. That is why finding the best indicator for day trading SPX is less about magic formulas and more about choosing tools that fit its unique rhythm.
In this guide, we share a streamlined approach based on real trading experience. Instead of chasing every signal, we focus on a small but powerful stack that filters noise, highlights momentum, and helps manage risk. By the end, you will see how fewer indicators can give more confidence and why discipline matters as much as the tools themselves.
Key takeaways:
- SPX day trading demands clarity, not clutter. Too many indicators create hesitation and losses.
- VWAP is the intraday anchor, with EMAs, RSI, ATR, and MACD adding structure and momentum insight.
- A trading indicator stack works best: trend-following, mean-reversion, and breakout setups each have their own tools.
- Three practical playbooks VWAP reclaim, EMA 9/21 pullback, and Bollinger Band squeeze give traders step-by-step guidance.
- Common traps include overloading charts, ignoring time-of-day patterns, and forgetting news or volatility context.
- There is no holy grail; the best spx indicators 2025 are those you master with discipline, context, and risk management.
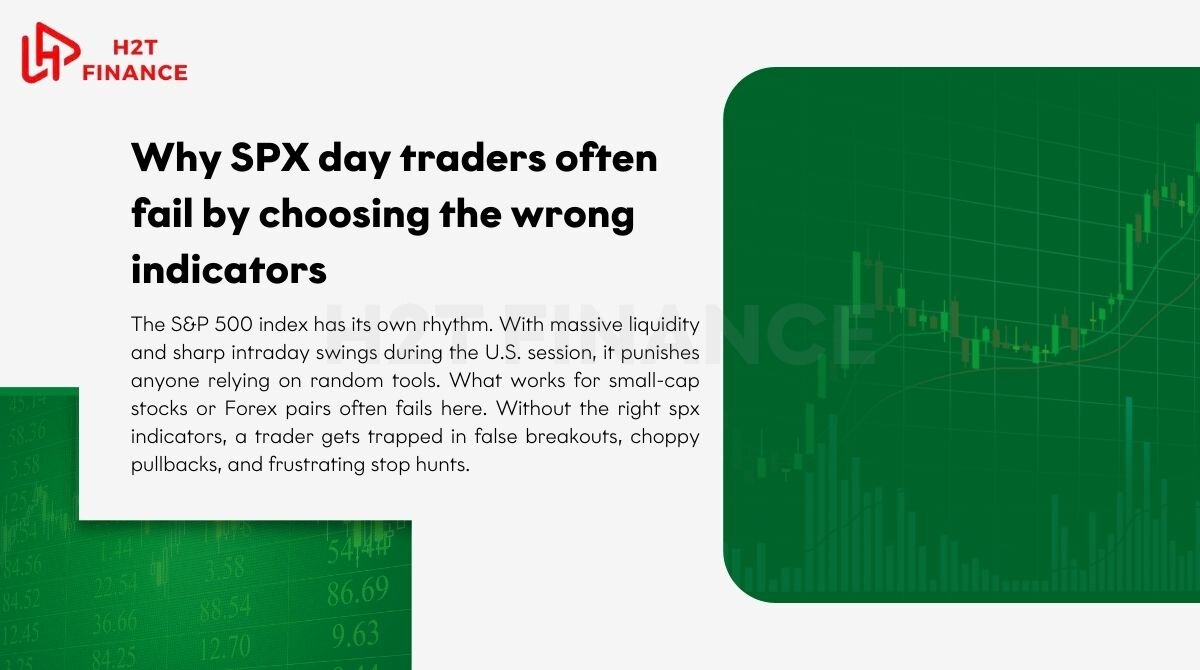
1. Introduction: Why SPX day traders often fail by choosing the wrong indicators
The S&P 500 index has its own rhythm. With massive liquidity and sharp intraday swings during the U.S. session, it punishes anyone relying on random tools. What works for small-cap stocks or Forex pairs often fails here. Without the right spx indicators, a trader gets trapped in false breakouts, choppy pullbacks, and frustrating stop hunts.
It was our bottom line that taught us the hard lesson that piling on more tools doesn’t lead to better intraday trading tips. In fact, too many indicators just create analysis paralysis, missed entries, and emotional trades. The real key is using a minimalist stack just enough to filter noise, confirm momentum, and most importantly, keep our heads clear as a team.
That is why this guide exists. We promise to keep it simple: a clear playbook of practical, battle-tested indicators for day trading SPX. Nothing mystical, no magic formulas just tools that fit the unique behavior of the index and rules you can apply on your very next session.
Summary:
- Most traders fail on SPX because they overload their charts with conflicting indicators.
- With its volatility and news-driven moves, the index demands a focused approach.
2. What is SPX day trading and how is it different from Forex or single stocks?
At its core, what is spx trading? It means trading the S&P 500 index in short timeframes, usually through futures like ES/MES, ETFs such as SPY, or SPX options. Many traders also compare it with how big is the foreign exchange market to understand scale and liquidity differences.
Unlike chasing individual tickers, you are trading the heartbeat of 500 of the largest U.S. companies. That scale makes the index more stable than penny stocks but also far more reactive to market-wide events.
Here’s the catch: the SPX moves in bursts. Every morning at 9:30–10:30 EST, we often see explosive volatility as institutions push their first orders, just like traders watch what time does the forex market open to catch the most active sessions.
Later, during the “power hour” from 3–4 PM EST, the tape heats up again with end-of-day positioning. In between, the market may drift, giving false signals to anyone relying only on lagging tools. That timing factor alone separates day trading S&P 500 from most Forex or small-cap setups.
Trust us, you haven't really traded until you've been on the wrong side of a Fed Chair speech. Watching the index dive 30 points in minutes because of a few spoken words is a humbling experience for any trader.
While Forex pairs might grind slowly, SPX reacts instantly, punishing any hesitation and only rewarding iron discipline. That is why knowing the spx index explained in its context is critical: you are not just trading a chart pattern, you are trading the pulse of the U.S. economy.
3. Principles of choosing the best indicator for SPX intraday
When we first looked for the best technical indicators for spx, we made the mistake of downloading every free tool on TradingView. The result? A noisy chart that left us frozen at the exact moment we needed to act. Over time, we learned that choosing an indicator for SPX intraday is less about finding the “holy grail” and more about applying simple rules.
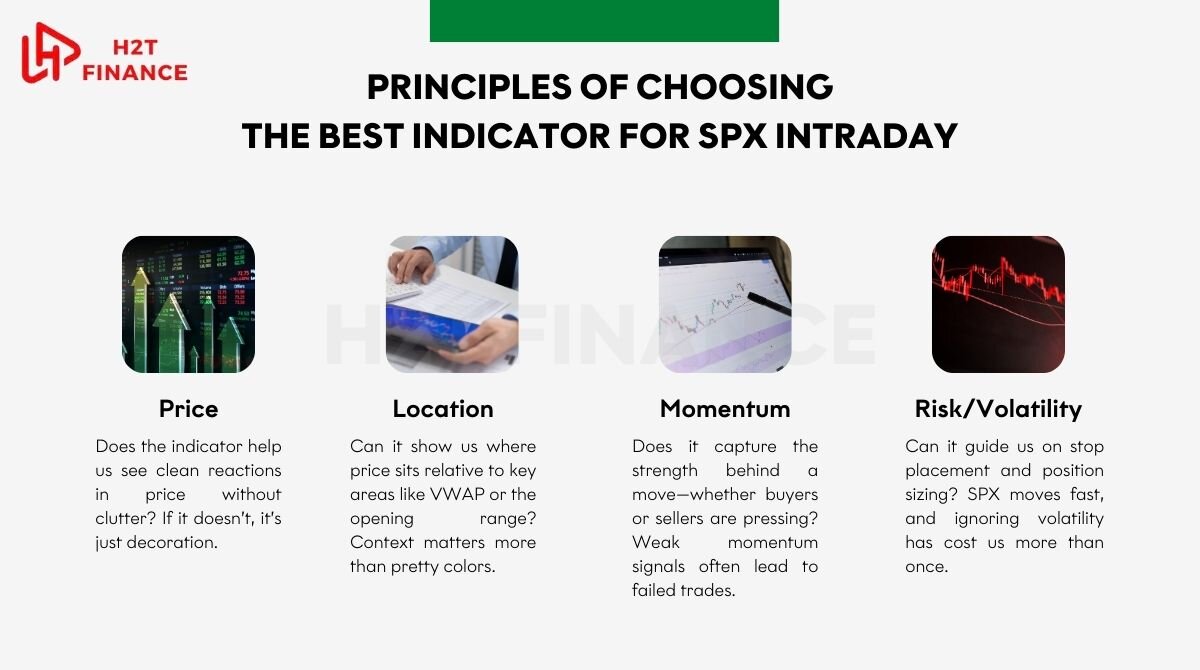
Here are the four filters we now use:
- Price: Does the indicator help us see clean reactions in price without clutter? If it doesn’t, it’s just decoration.
- Location: Can it show us where price sits relative to key areas like VWAP or the opening range? Context matters more than pretty colors.
- Momentum: Does it capture the strength behind a move whether buyers or sellers are pressing? Weak momentum signals often lead to failed trades.
- Risk/Volatility: Can it guide us on stop placement and position sizing? SPX moves fast, and ignoring volatility has cost us more than once.
A good indicator must be easy to read, have minimal lag, and fit the rhythm of SPX. Anything that slows decision-making becomes a liability. Many traders break intraday trading rules by stacking too many indicators, hoping more signals will bring more certainty. In reality, it often brings hesitation, confusion, and emotional trades.
From our experience, a small, focused stack of tools always beats a crowded screen. You don’t need twenty signals you need two or three that align with what is price action and your plan.
4. Top 7 indicators for day trading SPX (with chart examples)
When we trimmed our toolkit down to a handful of reliable indicators, our trading improved dramatically. These seven tools are not magic, but they work with the rhythm of SPX and keep the chart clean. Each has a role, and together they create a balanced intraday playbook.
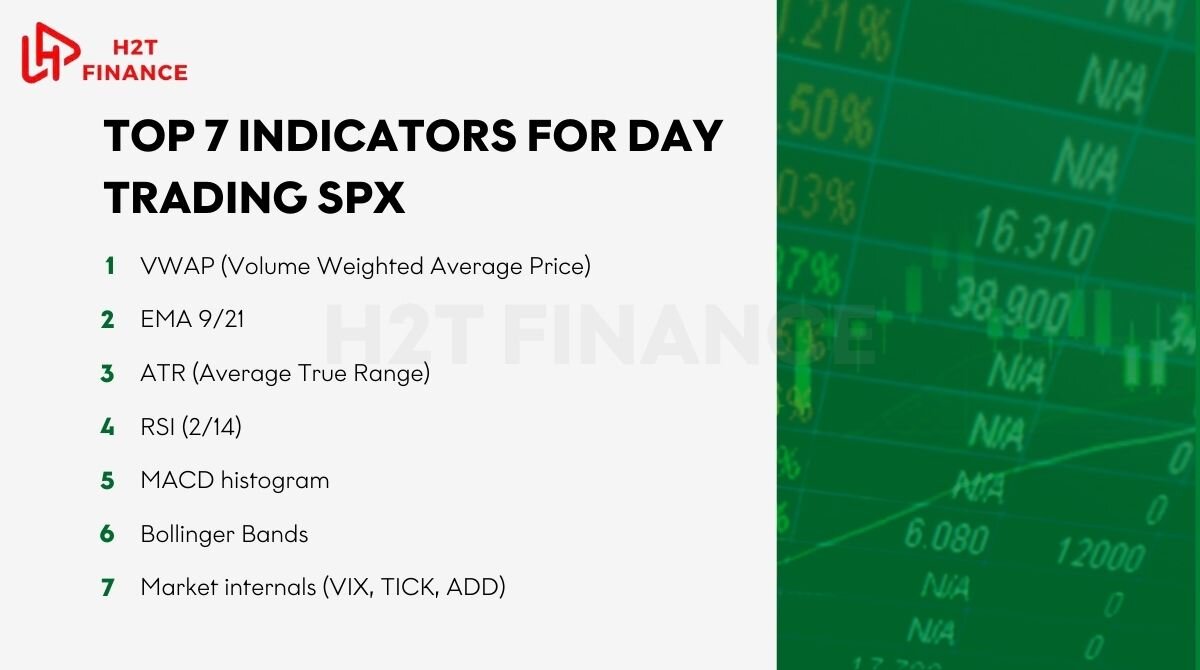
4.1. VWAP (Volume Weighted Average Price) – the intraday anchor
For us, VWAP is the backbone of intraday trading. Most institutions use it as a benchmark, which means price often reacts around it. Watching vwap spx during the opening hour shows whether buyers or sellers are in control. A reclaim of VWAP after a morning sell-off has been one of our highest-probability long setups.
4.2. EMA 9/21 – trend and momentum filter
The EMA 9/21 combo gives quick insight into short-term momentum. When the 9 EMA crosses above the 21 EMA near VWAP, it often confirms that buyers are stepping back in. We use it to avoid fighting the trend, and it keeps us from shorting into strong rallies.
4.3. ATR (Average True Range) – volatility and stop placement
SPX can swing 30–50 points in a session. Without a volatility gauge, stops get hit too easily. That’s where ATR day trading becomes critical. By sizing stops based on ATR, we avoid placing them “too tight” where market noise can knock us out.
4.4. RSI (2/14) – quick overbought/oversold signals
We experimented with different settings, and the rsi spx strategy using a 2-period RSI highlights sharp exhaustion points. In fast markets, it can catch short-term reversals when price stretches too far from VWAP or EMAs. Still, we treat it as a timing tool, never a standalone entry signal.
4.5. MACD histogram – confirming momentum shifts
The histogram version of MACD is less laggy than the crossover lines. We use it to see when momentum is fading, especially after a strong morning move, similar to how to use fibonacci retracement for spotting turning points. If the histogram starts shrinking while price presses highs, it warns us to take profits before a pullback.
4.6. Bollinger Bands – squeeze and breakout setups
When volatility contracts, SPX often coils inside Bollinger Bands before a breakout. We look for squeezes near VWAP or key levels. A breakout with expanding volume usually gives a clean run.
Getting caught in a fakeout from a Bollinger bands indicator squeeze is a rookie mistake we’ve all paid for in our early days. Now, we only take these setups when momentum gives us a solid confirmation.
4.7. Market internals (VIX, TICK, ADD) – context and sentiment
No indicator on the SPX chart can replace context. VIX measures volatility expectations, NYSE TICK shows buying vs. selling pressure, and the Advance/Decline line (ADD) reveals breadth. Together, these tools keep us from going long when the broader market is flashing risk-off.
The top 7 indicators for day trading SPX are VWAP, EMA 9/21, ATR, RSI, MACD histogram, Bollinger Bands, and market internals. Each plays a role VWAP anchors price, EMAs filter trend, ATR sizes risk, RSI times reversals, MACD confirms momentum, Bollinger Bands catch breakouts, and internals give sentiment context. A balanced use of these tools creates cleaner setups and reduces noise.
5. How to combine indicators into an effective stack
One of the biggest mistakes we made early on was treating indicators like a menu picking one today, another tomorrow, hoping to find “the best.” The truth is, indicators work best when stacked together for a clear purpose. A good trading indicator stack doesn’t overwhelm you with signals; it aligns price, momentum, and risk so you can act with confidence.
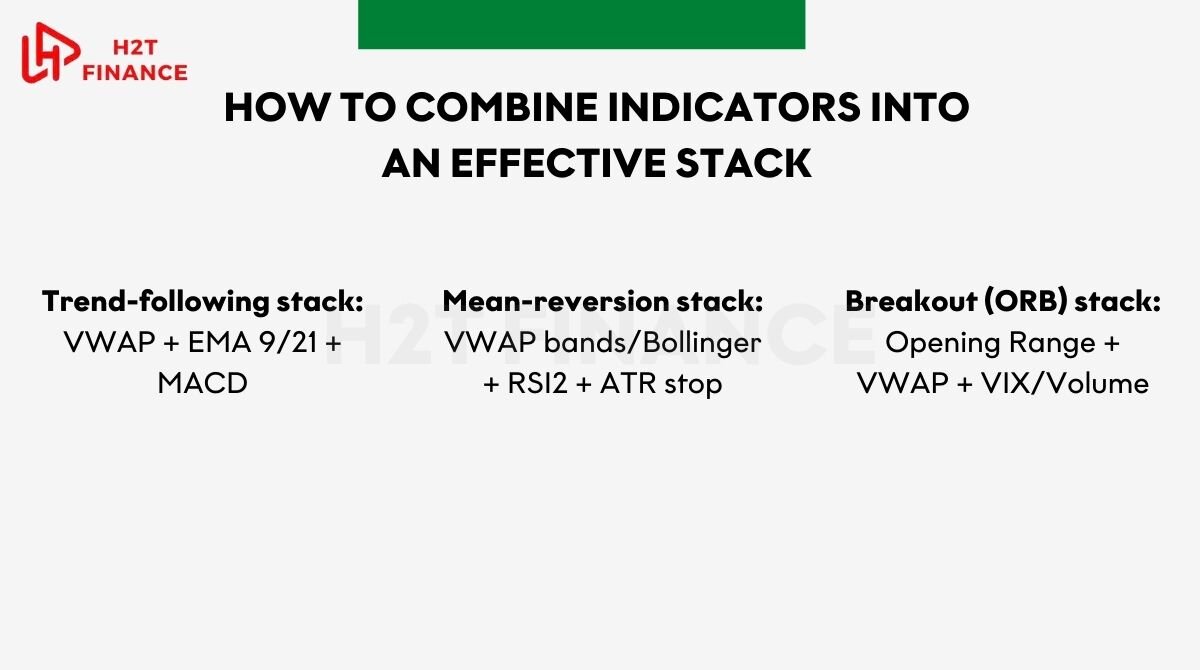
5.1. Trend-following stack: VWAP + EMA 9/21 + MACD
When the market is trending, this trio keeps us on the right side. VWAP acts as the backbone, the EMAs filter momentum, and MACD confirms if the trend still has fuel. On trending mornings, this stack has saved us from fighting against strength.
5.2. Mean-reversion stack: VWAP bands/Bollinger + RSI2 + ATR stop
Not every move lasts forever. When price stretches far from VWAP, we look at Bollinger or VWAP bands combined with a 2-period RSI for exhaustion.
ATR then tells us where a realistic stop belongs, in the same way that learning what is a stop limit order helps traders manage risk. This stack helps us catch snap-backs without gambling blindly.
5.3. Breakout (ORB) stack: Opening Range + VWAP + VIX/Volume
The opening range breakout is a favorite for SPX scalpers. By combining the first 15-minute range with VWAP and volume/VIX confirmation, we filter false breaks from real ones. This spx scalping setup can deliver powerful moves when momentum is aligned.
We’ve lived both sides of these stacks, entering too early without confirmation and paying the price, or waiting for all three tools to agree and catching clean runs. The difference is night and day.
6. Three sample playbooks (step-by-step setups)
Having indicators is one thing, but knowing how to use them in real time is another. Over the years, we built a few reliable patterns that turned chaos into structure. These are not theories, they are setups we’ve traded, adjusted, and trusted. Each spx trading strategy below is designed to be actionable the very next session.
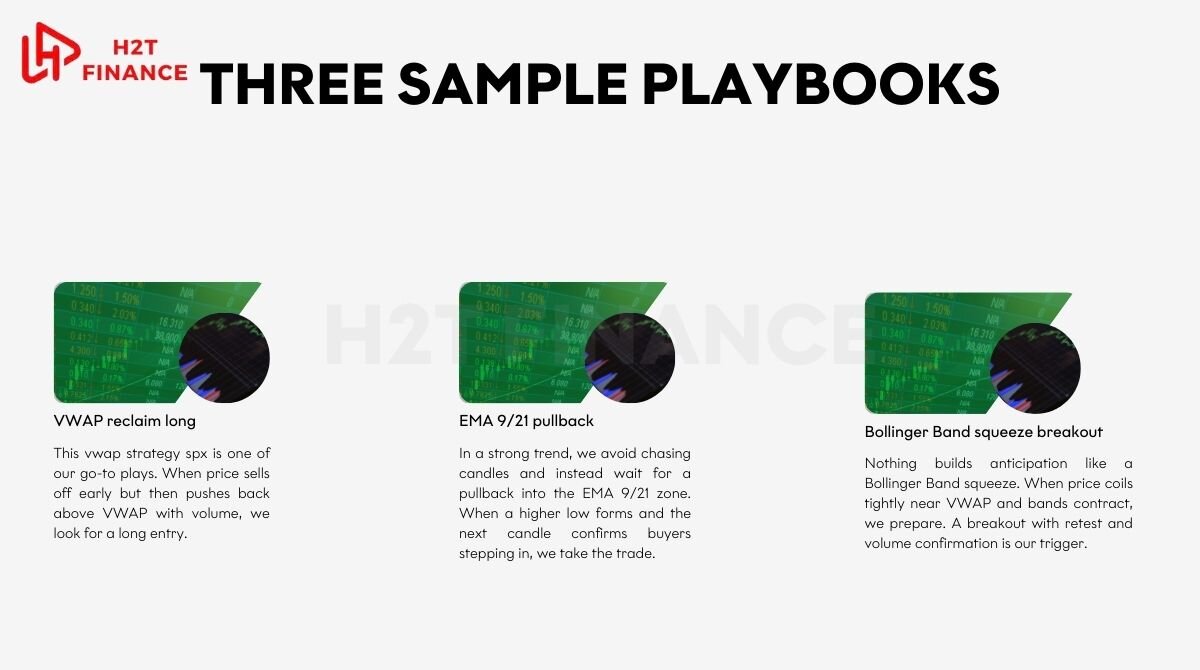
6.1. VWAP reclaim long
This vwap strategy spx is one of our go-to plays. When price sells off early but then pushes back above VWAP with volume, we look for a long entry. Our stop goes just under VWAP minus one ATR, and the target is based on a clear risk-to-reward ratio (usually 2R or better). We’ve seen this reclaim act like a magnet, pulling price back toward equilibrium.
6.2. EMA 9/21 pullback
In a strong trend, we avoid chasing candles and instead wait for a pullback into the EMA 9/21 zone. When a higher low forms and the next candle confirms buyers stepping in, we take the trade. This ema pullback spx strategy has kept us from entering at the very top and has given us safer entries with defined risk.
6.3. Bollinger Band squeeze breakout
Nothing builds anticipation like a Bollinger Band squeeze. When price coils tightly near VWAP and bands contract, we prepare. A breakout with retest and volume confirmation is our trigger. The energy release after a squeeze can fuel big moves, but patience is key, jumping too early often leads to whipsaws.
We still remember the first time we traded these setups properly. Instead of reacting emotionally, we followed the rules step by step, and the difference was immediate. Structure gave us confidence, and confidence allowed us to stick to the plan.
The three sample playbooks are VWAP reclaim long, EMA 9/21 pullback, and Bollinger Band squeeze breakout. Each gives traders a structured, repeatable setup. Following these spx trading strategies step by step reduces guesswork and replaces emotion with discipline.
7. Common mistakes when using indicators to trade SPX
When we look back at our early trades, most of our losses came not from bad luck but from how we used indicators. The tools themselves weren’t the problem, it was the way we applied them. These are the traps we fell into, and they remain some of the most dangerous trading mistakes beginners make.
7.1. Overloading the chart with indicators
We once believed that stacking ten indicators would give us more certainty. In reality, it only created contradictions. One tool flashed buy, another screamed sell, and we froze. This is one of the most common indicator traps thinking more signals equal more accuracy. The truth is, too many tools kill confidence.
7.2. Ignoring the time-of-day effect
SPX doesn’t move the same all day. The opening and power hour are filled with energy, but mid-day often brings dead volume. Early on, we took trades at noon just because an indicator flashed. More often than not, those setups failed. Ignoring timing is a mistake we had to pay for before we learned that context matters as much as the signal itself.
7.3. Forgetting news and volatility context
That pit-in-my-stomach feeling is something we'll never forget: shorting what looked like a perfect technical setup as a team, only to have a surprise Fed announcement send the market screaming 20 points against us. That's when it truly sank in: even the best indicator combination can’t read news or volatility shocks. If you don’t pair your tools with awareness of events, you’re trading blind.
The most common mistakes when trading SPX with indicators include overloading charts, ignoring time-of-day effects, and forgetting news or volatility context. These trading mistakes beginners face are preventable, but only if we treat indicators as part of a bigger picture rather than absolute truth.
Read more:
8. FAQs – Frequently asked questions
8.1. Can VWAP be used for Forex or crypto like SPX?
Yes, VWAP works anywhere there’s volume, but it shines most on highly liquid assets like SPX. In Forex, volume data is limited, so results can be less reliable. Crypto has its own quirks, but VWAP still helps define fair value zones.
8.2. Is RSI2 too noisy?
It can be, especially for day trading indicators beginners often rely on without context. On SPX, a 2-period RSI works best when paired with VWAP or Bollinger Bands. Alone, it fires too many signals.
8.3. Should I use one indicator or combine a stack?
One tool rarely gives enough context. We’ve seen better results stacking two or three with clear roles for example, VWAP for bias, EMAs for trend, RSI for timing. The key is clarity, not quantity.
8.4. Is EMA 9/21 different from EMA 8/21?
The difference is minor, but 9/21 is widely used by SPX traders, making it more self-fulfilling. When more eyes watch the same levels, reactions tend to be sharper.
9. Conclusion
Let's be blunt: there is no holy grail. Anyone searching for the "best indicator for day trading spx" hoping to find a magic buy sell signal indicator is already on the wrong path. Instead of looking for a secret tool, success comes from building a simple, consistent stack and truly mastering it to match the rhythm of the S&P 500. VWAP, EMAs, RSI, ATR, and a few others work when used with purpose, not when cluttered on a screen.
We’ve learned that success comes less from the indicator itself and more from how you apply it. Discipline, context, and risk management turn a setup into a strategy. Without them, even the cleanest chart fails. With them, a minimalist approach can guide you through the noise and keep you alive long enough to grow.
If you want to go deeper, start by practicing these setups on demo accounts. Backtest at least 20 sessions, record your results, and compare against structured notes. For those who like having a reference, we’ve built spx trading strategies pdf resources that condense the rules into a one-page playbook perfect for keeping on your desk.
H2T Finance exists to share real strategies, tools, and lessons without the hype. Follow our blog or join the mailing list to access advanced setups, practical guides, and deeper insights. Above all, trade with patience, and remember: clarity beats clutter every time.